Display and Merchandising Analytics in the Store
Display and Merchandising Analytics in the Store
By Gary Angel
|August 19, 2020
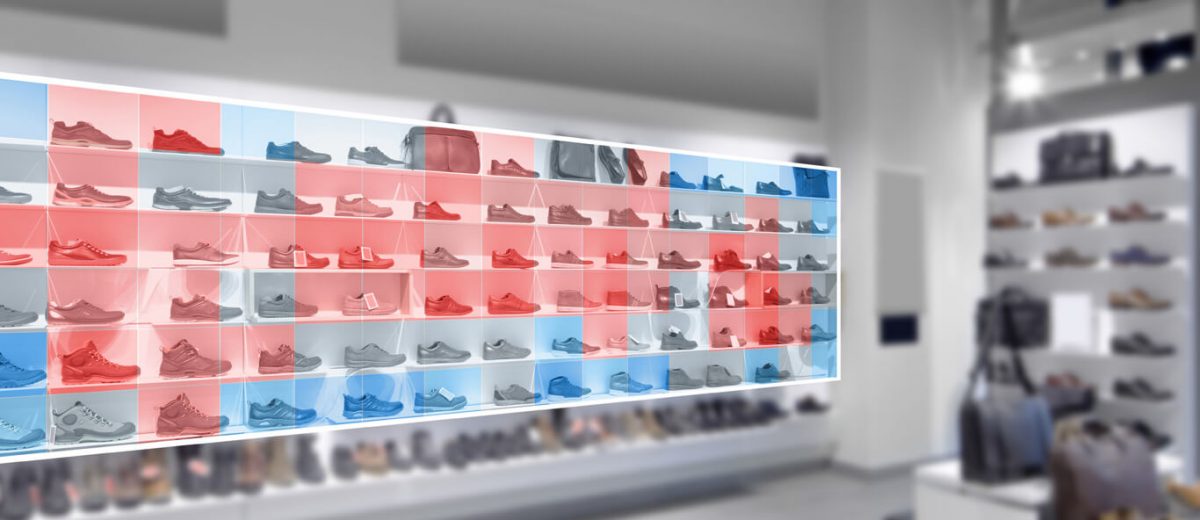
You have a new display. A feature table. A shoe wall. An endcap. And you want to know if it’s working. You can and should measure product sales. But that tells you nothing about opportunity or conversion. It’s hard to tell how well a display works if you don’t know how many people saw it. That’s a problem. Because merchandising display is the heart of physical retail. Showing and getting hands on product IS the point. Being good at it is the key to creating competitive advantage with a store. And if you can’t measure the main point, you’re hosed.
Believe it or not, stores often have little or no idea how well individual displays work. And while both centralized merchandising teams and local store managers will often “test” different configurations, I used quotes on the test because the actual feedback loops are challenging or even non-existent.
But measurement – and pretty advanced measurement at that – is surprisingly easy. You can track how many shoppers pass-by a display. How many stop. How long they spend. Whether and Which products they interact with. Even if they take something away. It’s the rare analytics effort that solves an immediate problem and spurs easy direct action.
Basic Display Measurement
By Combining ML and video, you get a much richer and deeper understanding of display performance. That starts with opportunity. Typical store measurement leaps from door to PoS with nothing in between. So most of the time, display measurement starts with the most simple metric of all: traffic. Fortunately, this kind of people-counting is bread-and-butter for camera measurement. Basic counting gets you a good measure of opportunity.
But opportunity is only the first level in the marketing funnel.
So much of what we want to understand about display – and particularly important in terms of the visual appeal of the display itself – is whether it caught visitors attention. The easiest way to measure that is with time.
There are eyeball tracking techniques, and they can color to the equation. But seriously, if a shopper doesn’t stop, then a display hasn’t really captured enough attention to matter. With precision tracking, even very short stops are trackable.
This is a place where you’ll likely want to play around with different levels of time engagement. From short pauses (a few seconds at the display) to extended shopping visits where the the shopper spent minutes at the display.
We like to capture and threshold time into levels of engagement so that engagement itself capture 2 or even three levels of the display marketing funnel.
With standard measurement cameras, Opportunity and Time-based engagement are as deep as you can go. But by adding powerful edge based processing – you can take the Display Analytics Funnel one step further.
The next step is to understand whether the display created actual engagement. What we’re looking for here is people stopping and looking. Most display concepts are targeted to heavily trafficked areas – meaning a lot of the shoppers who pass them by are headed somewhere else. A key metric of display performance is the percentage of shoppers who stop and take a look. Looking is particularly interesting because a lot of purchase may happen in section not at display.
For a display arrangement (like multiple tables or tables and racks), this looking metric is supplemented by measurements of flow. When people engage with a display it often changes their path and it dramatically improves their likelihood of subsequent engagement. So how you layout displays and their relationship to each other makes a huge difference in performance.
With just these three metrics: Opportunity, Engagement and Flow, you can do a lot of display optimization and testing. Optimization that’s never really been possible before. You can measure whether a new display engages more shoppers or holds them longer. Whether the layout in an area is optimal. And how moving product or layout impacts engagement. That’s all powerful, actionable, testable insight. But, as I’ll explain in my next Minute, the display measurement we’ve been developing takes this to a whole other level.
Interactions and Product Optimization
Merchandising display is the heart of physical retail. Showing and getting hands on product IS the point. Being good at it is the key to creating competitive advantage with a store. People-counting at the display provides a measure of Opportunity. Time at Display provides a tiered measurement of engagement. One that’s quite accurate. And Flow measures how people move around and past one or more display elements. With just these three KPIs, you can develop a much better picture of whether and how well a Display engages shoppers.
For many displays, though, it’s important to take the analysis one step further. Most display areas are multi-product and getting a real understanding of what’s working means understanding which products get noticed, touched and taken. Product interactions and take-aways are the two metrics we use to capture this level of merchandising detail.
Product interaction measurement is based on shopper’s reaching out and touching product. Not only does the Interaction metric take engagement to the next level, it can be product or area specific. That means you can tell, in a single display, which products draw the most interest. That lets you optimize product placement inside the display. Our research has shown that there are natural hot-spots in a display (similar to a web page) so you can’t just measure product interactions and assume it’s product driven. You have rotate and baseline products in the display and then measure whether a product is performing better or worse given it’s position.
Finally, you can measure product take-aways. This is actually the most challenging metric to capture from a machine learning perspective and it’s somewhat dependent on the type of product. Small, hard to distinguish products may not be trackable. But for more easily discernible products, the ability to measure the take-away is a straightforward path to full conversion measurement on the display.
Together, these five KPIs, Traffic, Engagement, Flow, Interactions and Take-aways provide full-funnel measurement on display merchandising and effectiveness and they’re everything you need to do effective testing.
Find out more or read a case study.