DM1 Version 2.0 : Coming Soon to a Store Near You
DM1 Version 2.0 : Coming Soon to a Store Near You
By Gary Angel
|November 13, 2017
When we released the first full production version of DM1 in May, it was a transformational leap in customer location analytics. Now, six months later, we’re releasing the first major upgrade to DM1 – and it’s a doozy. We’re adding powerful new approaches to improving the store and driving actionable results while putting the competition even further in the rear-view mirror (they’re back there somewhere). Some of the coolest new features include:
Real-time View: See and track what’s happening in the store as it happens
Real-time Messaging: Integrate with Associate and Shopper Mobile devices based on what’s happening right now
Playback: See what happened in the store using a time-lapse simulation of actual shopper behavior
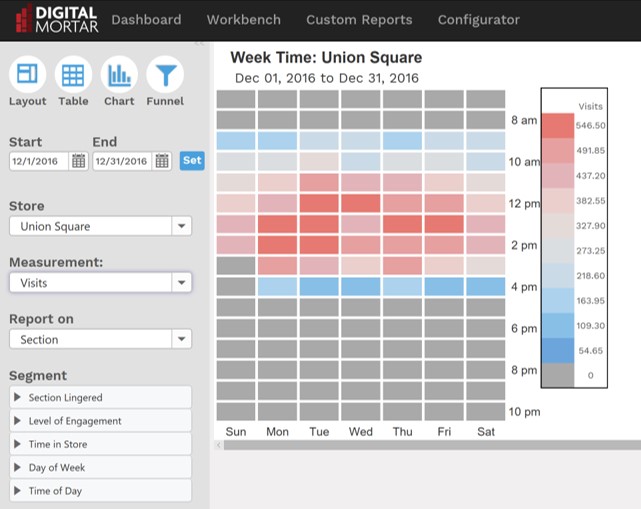
Week-Time: A cool new visualization that shows a Day-Time part analysis for ANY metric or segment
Flexible Cloud Hosting: Azure or Google Cloud, your choice.
And that’s just the big stuff. There have been a host of small tweaks, fixes, performance enhancements and visual improvements in the intervening months.
That initial version of DM1 had a pretty remarkable feature set for a V1 product in a brand new market. It delivered a revolutionary store visualization tool that mapped its powerful metrics into the store at any level of abstraction – from Display to Section to Department to Floor to Store. And the metric set if provided shattered existing door-counting paradigms by delivering real journey metrics. What shoppers did first. Where they spent the most time. Every place they shopped. What got the most consideration. What converted. What didn’t. And DM1 V1 integrated a rich set of Associate tracking metrics into the basic product as well. Associate presence, intra-day STARs, interaction rates and times, and associated lift. DM1 also delivered powerful grid-based reporting and charting, a really cool funnel analytics tool and a powerful side-by-side comparison tool.
With the new features, we’ve focused on adding a set of capabilities that extend DM1 deeper into the store and make it easier to integrate into broader store marketing and operations efforts. The biggest part of that is, of course, real-time.
We’ve always collected store data in real-time – and all of our collection technologies support near real-time data about the shopper. But in the V1 release, everything we did was batch processing and next-day analytics. That isn’t just because batch processing is easier (though that did matter to us). It was also because many years of experience in digital analytics convinced us that the applications for real-time analytics were fairly rare. There was a time when real-time reporting was a huge part of the digital analytics sales process. But in the end, the dominant tools in digital analytics deliver intra-day but far from real-time analytics. So we figured if a very mature market like digital analytics could do without real-time, we didn’t need it for our V1 release.
But the store is different beast than a Website, and we’re finding that having a real-time view of what’s happening makes it possible to add value at the Store Manager level AND support both CRM and queue management applications that help improve the customer experience.
So real-time became a central piece of our V2 release. And once we built out the core capability, we took advantage of it in multiple ways.
The Realtime view show’s what’s happening right now in the store. Associates and Shoppers are shown (using different symbols) and you can quite literally track exactly where they are and where they are going. We even color-code Shoppers to make it easy to identify how long they’ve been in the store.
Check it out:

Pretty cool. The Playback capability provides the same view but processes historical data. Since it’s historical, it can collapse time periods into a time-lapse view. So you can see an hour or a day in five minutes.
Being able to see real-time data is cool and highly useful for folks on the ground, but I won’t claim the analytic implications are enormous. What is enormous, though, is the capability to tie DM1’s tracking and measurement into real-time messaging systems. We’ve built a straightforward Webhook messaging interface that lets you get three kinds of data out of DM1: current metric data (for uses like queue length), real-time shopper data, and real-time Associate data.
The real-time shopper data can be based off any customer key we have. And it provides a CRM view that includes Entry Time, Total-Time in Store, Presence and Lingers by Section, Current Location, Time since Interaction, and Associate ID of last interaction. You can use this data to generate real-time messages via your mobile application or in-store beacons to the shopper.
As cool as this shopper interface is, I’ve long been a believer that messaging Associates is even more fundamental and important. With shoppers, opt-in is always a challenge. And barring a truly compelling application, I think it’s tough to get enough opt-ins for messaging to make it impactful. But Associates are increasingly being armed with digital tools that allow them to do more (like distributed PoS) and serve the customer better. Being able to optimize Associate interactions with real-time data and positioning is a huge leap forward in operational sophistication.
In addition to real-time, we’ve made a boatload of analytic enhancements too. And one of my favorite new views is the WeekTime report. We’d already build a custom report around staffing that laid out STARs (Shopper to Associate Ratio) by day of week and time of day (down to the hour). But that report wasn’t a thing of beauty and, in any case, it was specific to the STARs metric.
Because Day-time parting is so fundamental to the store, we wanted a generalized analytics tool that would do the job. The WeekTime tool lays out any metric by day-of-week and time-of-day.
Here are some examples of the WeekTime tool. The first view shows when the store had the most shoppers. The second view shows when shoppers spent the most time in the store.
| Shopper Traffic by Day-Time | Avg. Shop Time by Day-Time |
 |
 |
And like all DM1 workbench tools, the Weektime tools is driven by our big data event-level engine so it supports integrated segmentation across any time-period. It’s a really nice analytic addition to the Workbench and the Dashboard view. It makes it much easier to quickly visualize and understand how day-time parts are driving performance on any measurement.
One of the biggest changes we made in V2 isn’t functional but environmental. We built DM1 on Azure and it’s been a great platform. But we’ve seen that our clients are going in all sorts of directions in an incredibly competitive cloud marketplace. And if the rest of your infrastructure is on Google Cloud (GCP), then it just makes sense that DM1 live there too. So in V2, we offer the choice of cloud provider. We’ve ported the entire platform into GCP and – as a bonus gift to ourselves – made the deployment process a lot more automated and easier for us. Microsoft Azure or Google GCP – it’s now your choice. And it’s just part of making sure DM1 is the most technologically sophisticated AND seamless platform around.
V2 is another big step for us. But we’re just getting started. I keep an ever-growing Trello board of new features and some of the most exciting stuff to come includes a full real-time Store Manager tool, a much more comprehensive and beautiful Associate performance report, a store-change report that automatically shows you the impact of every store change in a period of time, the integration of D3 into our charting capability, a full pathing tool, a robust segmentation builder, and even an initial foray into machine learning.
Can hardly wait!