In-Store Measurement: Store Visualization and DM1
In-Store Measurement: Store Visualization and DM1
By Gary Angel
|May 31, 2017
Location analytics isn’t really about where the shopper was. After all, a stream of X,Y coordinates doesn’t tell us much about the shopper. The interesting fact is what was there – in the store – where the shopper was. To answer most questions about the shopper’s experience (what they were interested in, what they might have bought but didn’t, whether they had sales help or not, and what they passed but didn’t consider), we have to understand the store. In my last post, I explained why the most common method of mapping behavior to the store – heatmaps – doesn’t work very well. Today, I’m going to tackle how DM1 does it differently and (in my humble opinion) much better.
Here are the seven requirements I listed for Store Visualization and where and why heatmaps come up short:

Designing DM1’s store visualization, I started with the idea that its core function is to represent how an area of the store is performing. Not a point. An area. That’s an important distinction. Heatmaps function rather like a camera exposure. There’s an area down there somewhere of course – but it’s only at the tiny level of the pixel. That’s great for a photograph where the smaller the pixel the better, but analytically those points are too small to be useful. Besides, store measurement isn’t like taking a picture. The smaller the pixel the more accurate the photo. But our measurement capture systems aren’t accurate enough to pinpoint a specific location in the store. Instead, they generate a location with a circle of error that, depending on the system being used, can actually be quite large. It doesn’t make a lot of sense to pretend that measurement is happening at a pixel location when the circle of error on the measurement is 5 feet across!
This got me thinking along the lines of the grid system used in classic board games I played as a kid. If you ever played those games, you know what I’m talking about. The board was a map (of the D-Day beaches or Gettysburg or all of Europe) and overlaid on the map was a (usually hexagonal) grid system that looked like this:

Units occupied grid spaces and their movement was controlled by grid spaces. The grid became the key to the game – with the map providing the underlying visual metaphor. This grid overlay is obviously artificial. Today’s first person shooter games don’t need or use anything like it, but strategy games like Civ still do. Why? Because it’s a great way to quantize spatial information about things like how far a unit can move or shoot, the distance to the enemy, the direction of an attack, the density of units in a space and much, much more.
DM1 takes this grid concept and applies it to store visualization. Picture a store:

Now lay a grid over it:

And you can take any place the shopper spends time and map it to a grid-coordinates:

And here’s where it really gets powerful. Because not only can you now map every measurement ping to a quantifiable grid space, you can attach store meta-data to the grid space in a deterministic and highly maintainable way. If we have a database that describes GridPoint P14 as being part of Customer Service on a given day, then we know exactly what a shopper saw there. Even better, by mapping actual traffic and store meta-data to grid-points, we can reliably track and trend those metrics over time. No matter how the shape or even location of a store area changes, our trends and metrics will be accurate. So if grid-point P14 is changed from Customer Service to Laptop Displays, we can still trend Customer Service traffic accurately – before, after and across the change.
That’s how DM1 works.
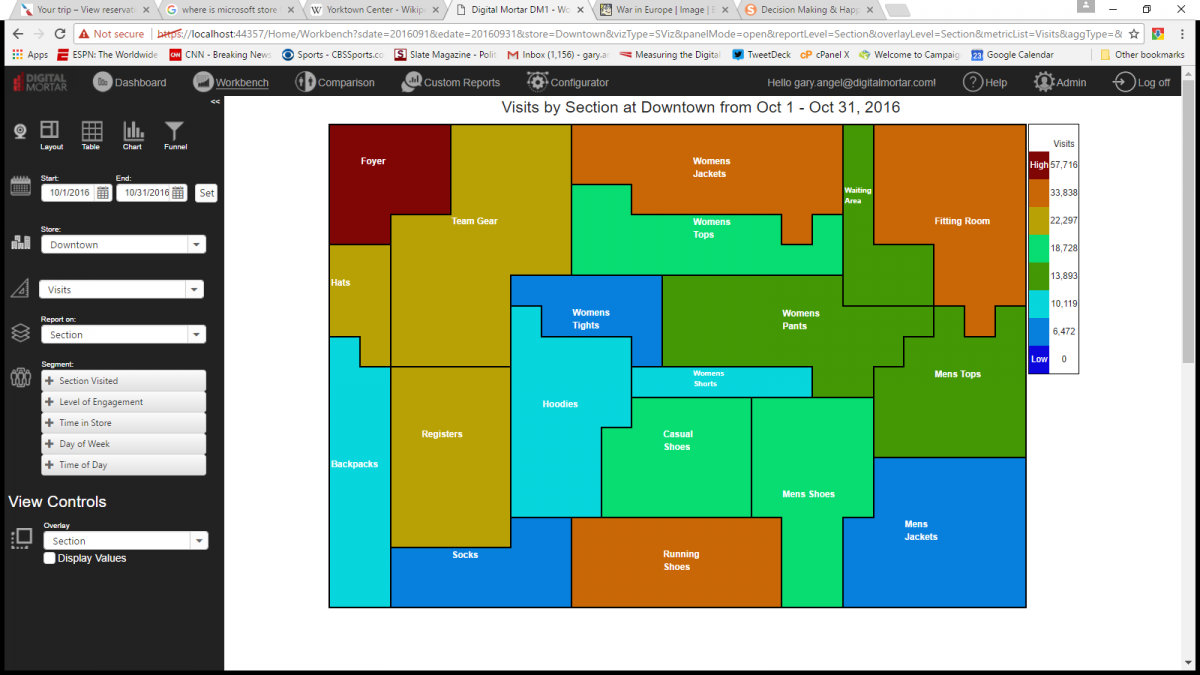
Here’s a look at DM1 displaying a store at the Section level:

In this case, the metric is visits and each section is color-coded to represent how much foot traffic the section got. These are fully quantified numbers. You can mouse over any area and get the exact counts and metrics for it. Not that you don’t need a separate planogram to match to the store. The understanding of what’s there is captured right along side the metric visualization. Now obviously, Section isn’t the grid level for the store. We often need to be much more fine-grained. In DM1, you can drill-down to the actual grid level to get a much more detailed view:

How detailed? As detailed as your collection system will support. We setup the grid in DM1 to match the appropriate resolution of your system. You’re not limited to drilling down, though. You can also drill up to levels above a Section. Here’s a DM1 view at the Department level:

In fact, with DM1, you have pretty much complete flexibility in how you describe the store. You can define ANY level of meta-data for each grid-point and then view it on the store. Here, for example, is where promotions were placed in the store:

DM1 also takes advantage of the Store Visualization to make it easy to compare stores – head to head or the same store over time. The Comparison views shows two stores viewed (in this example) at the Section Level and compared by Conversion Efficiency:

It takes only a glance to instantly see which Sections perform better and which worse at each store. That’s a powerful viz!
In DM1, pretty much ANY metric can be mapped on the store at ANY meta-data level. You can see visits, lingers, linger rate, avg. time, attributed conversions, exits, bounces, Associate interactions, STARs ratio, Interaction Success Rate and so much more (almost fifty metrics) – mapped to any logical level of the store; from macro-levels like Department or Floor all the way down the smallest unit of measurement your collection system can support. Best of all, you define those levels. They aren’t fixed. They’re entirely custom to the way you want to map, measure and optimize your stores.
And because DM1 keeps an historical database of the layouts and meta-data over time, it provides simple, accurate and easily intelligible trending over time.
I love the store visualization capability in DM1 and I think it’s a huge advance compared to heat-maps. As an analyst, I can tell you there’s just no comparison in terms of how useful these visualizations are. They do so much more and do it so much better that it hardly seems worth comparing them to the old way of doing things. But here it is anyway:

DM1’s store visualization is one powerful analytic hammer. But as good as they are, this type of store visualization doesn’t solve every problem. In my next post, I’ll show how DM1 uses another powerful visual paradigm for mapping and understanding the in-store funnel!
[BTW – if you want to see how DM1 Store Visualization actually works, check out these live videos of DM1 in Action]
One thought on “In-Store Measurement: Store Visualization and DM1”
Leave a Reply
You must be logged in to post a comment.
Thank you for your informative blog. The visualization are very interesting and helpful. If I understand it correctly, the visualizations show visits to the grid cells. How is the conversion attributed to each cell in your last visualization? Is it an allocation mechanism driven off of the traffic to each cell, or does the system have knowledge of which visitors actually converted?