Digital Mortar’s DM1 platform handles every aspect of people-measurement and crowd-analytics in complex airport environments. Flexible, dynamic queue measurement for every type of line, from Security, to Check-In, to Self-Check to Global Entry. Flow analytics across the entire airport. Detailed operational analysis of key chokepoints and high-value customer areas like food courts. Even full journey analytics for retail areas. It’s a single solution to every people-measurement problem you have.
What makes it so flexible? Versatile technology support: electronics, camera, LiDAR. Fully configurable real-time reporting. Built-in, consumable real-time AND analytic feeds. Integrated public-view builder. Dynamic digital mapping. On-premise or cloud. Operationally robust and fully redundant.
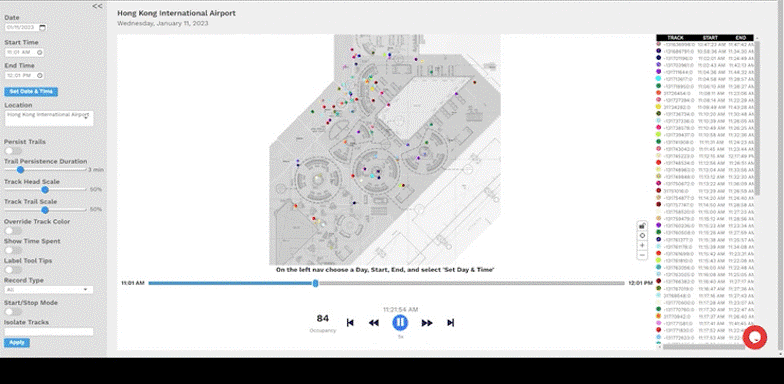
Any type of queue. Any type of area. Configurable digital mapping of spaces to support dynamic queue tracking in complex areas like check-in. Real-time dashboards. Deep analytics. Predictive alerting. Public views. Multiple counting methods. Advanced sensor data cleansing.
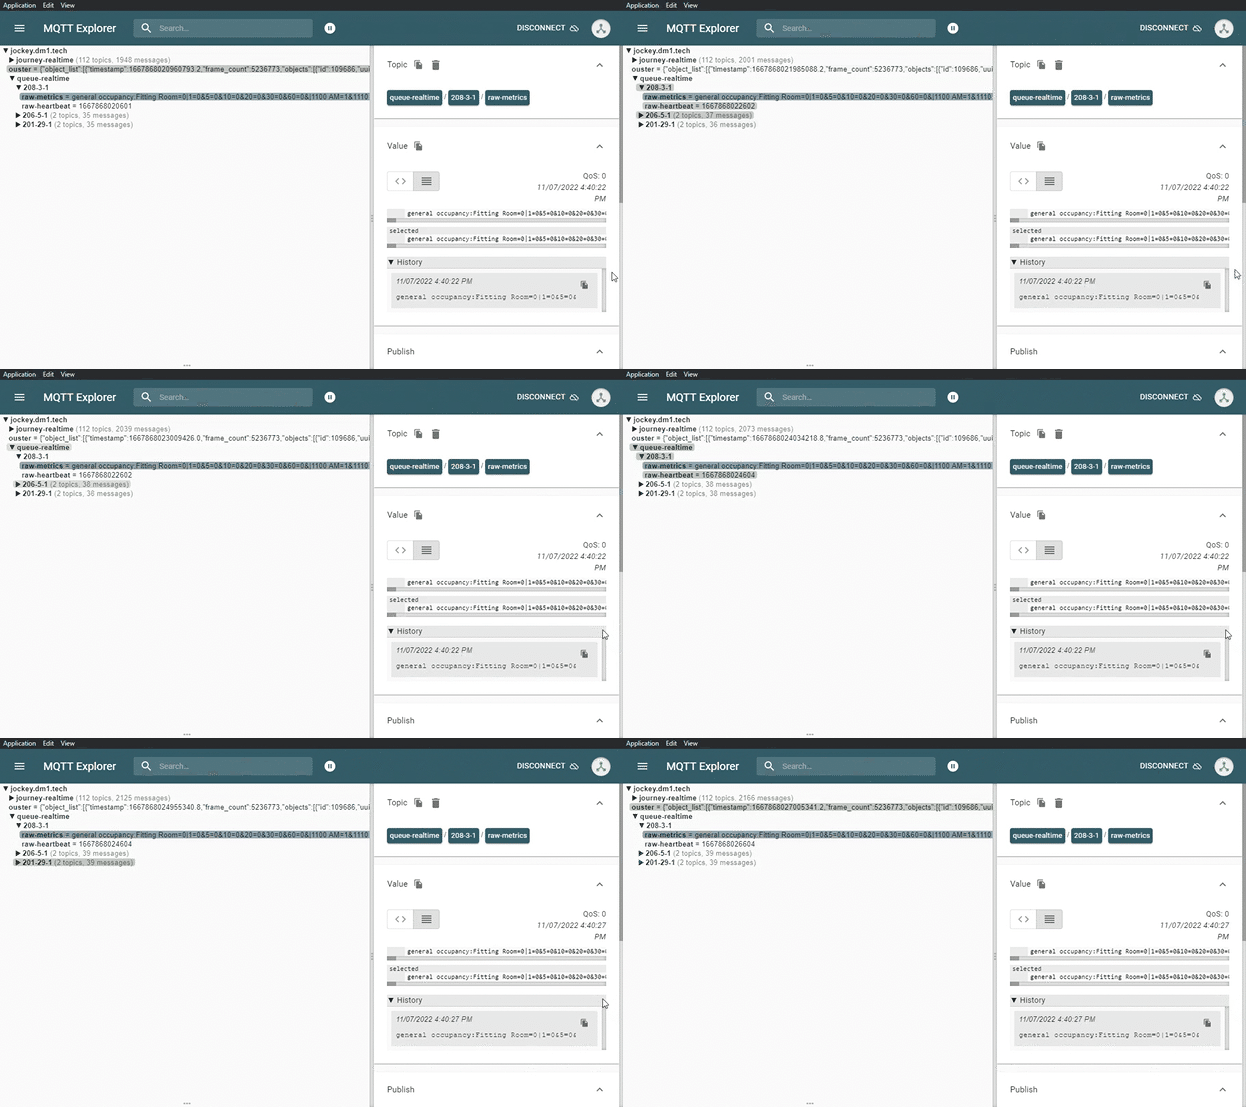
Take advantage of real-time monitoring and alerting for ANY measured area. In application or via MQTT real-time feed. Then drill-down into operational problems with advance metrics and full playback of customer movement and flow.
Track end-to-end flow across the airport or detailed individual level data in key areas. You can measure and analyze customer behavior at food-courts, in entry and egress zones, premium lounges, and self-check-in areas.
Deliver incredibly powerful retail analytics to your tenants. Every customer. Every behavior. Every step of the journey. What they looked at. What they didn’t. What drove conversion.
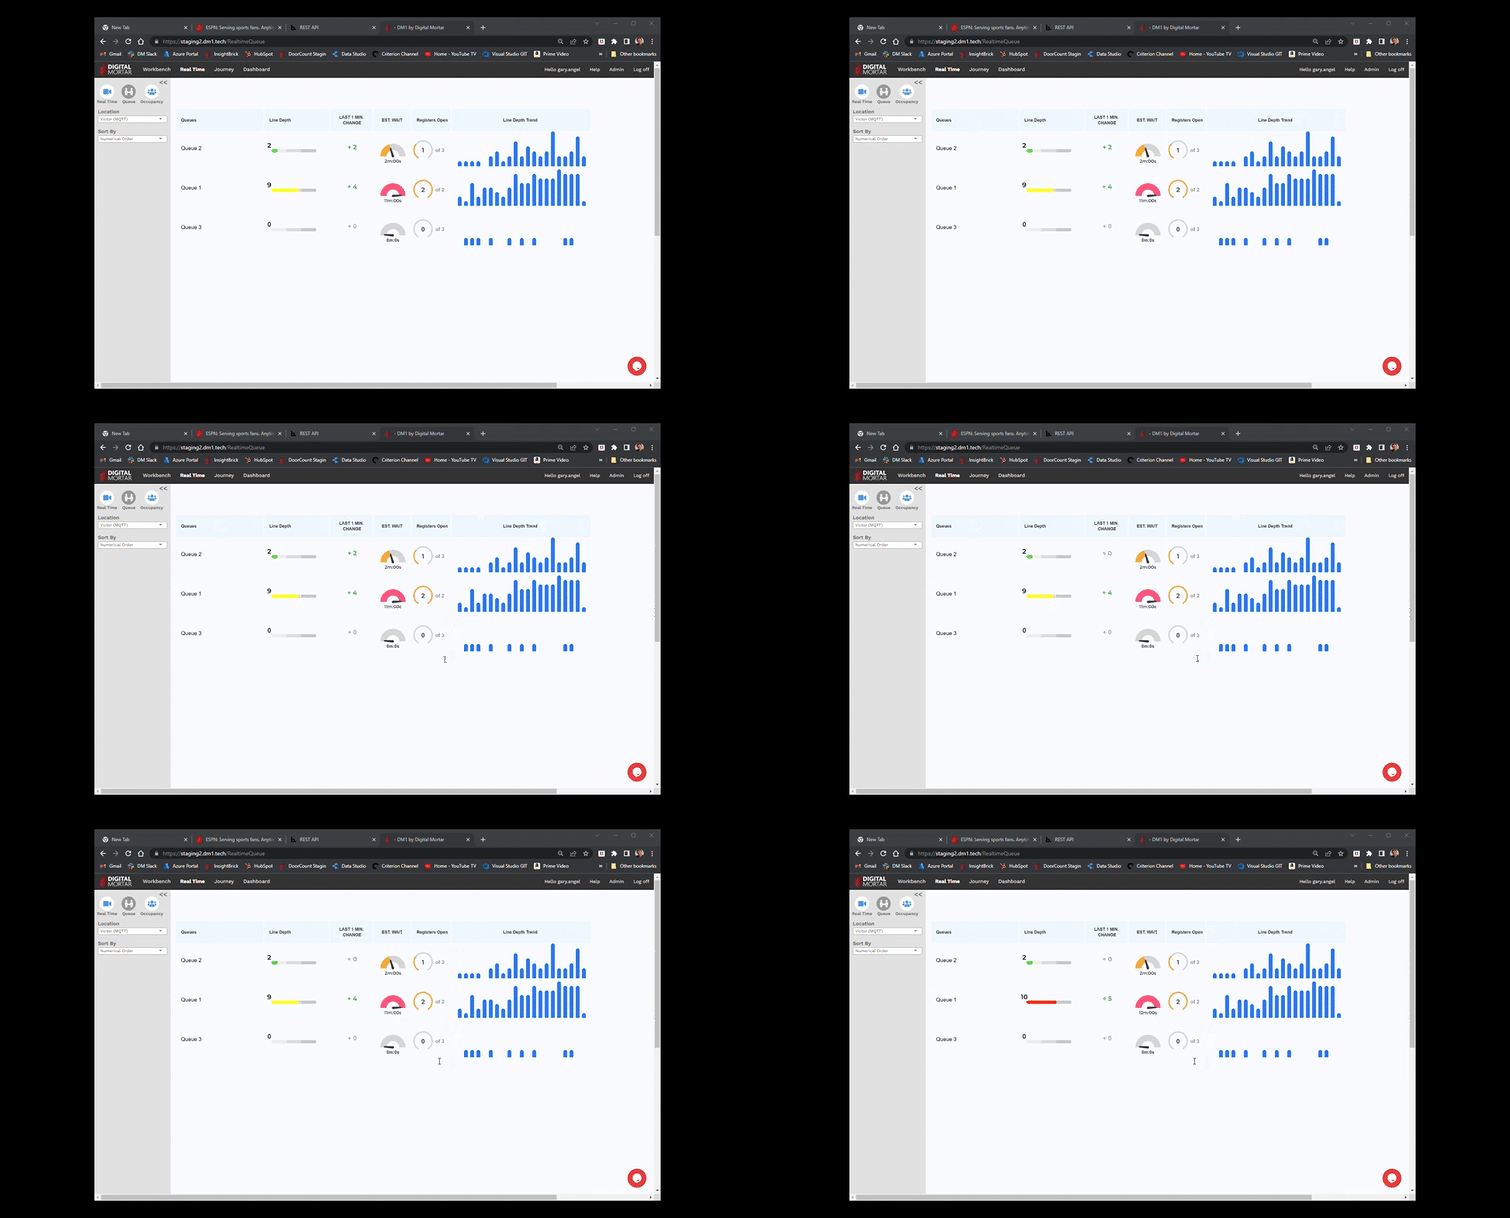
Airports present unique challenges to queue measurement – not least because there are so many different types of lines. Because our queue measurement is built on top of an advanced full-journey people-measurement systems, it’s extraordinarily flexible.
Measure occupancy or count enters & exits. Configure any line. Automatically track opening and closing of processing points. Choose a cleaning algorithm. Set a smoothing technique. Add group detection. Track historical numbers even when areas change configuration. Set and customize alerts. Deploy predictive models. Publish custom views in digital signage and apps. Seamlessly and inexpensively.
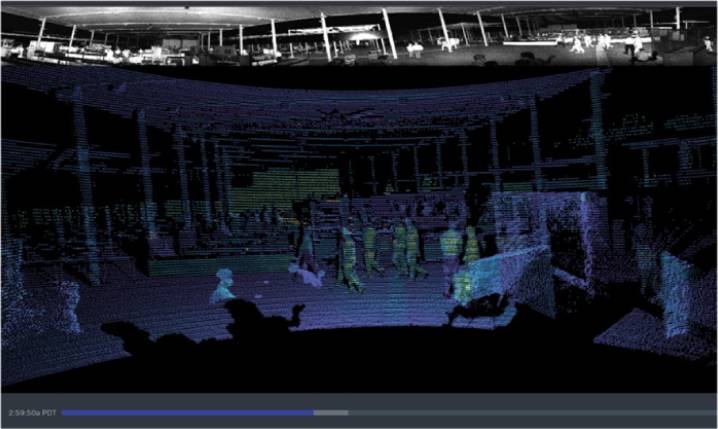
We integrate industry leading camera and LiDAR sensors from companies like Xovis, Hella, Quanergy and Ouster. Then we improve the data with advanced ML to remove problems and “stitch” tracks. The result is the BEST, most accurate, most detailed people-measurement data.
Configure any type of queue in any type of space. Need a giant snake line for Global Entry with 20 stations? No problem. Need multiple converging lines for security? That’s okay too? How about configuring 15 different queues in a big floor space for ticketing? Yep. You can do that. Add in self-check-in stations? No problem.
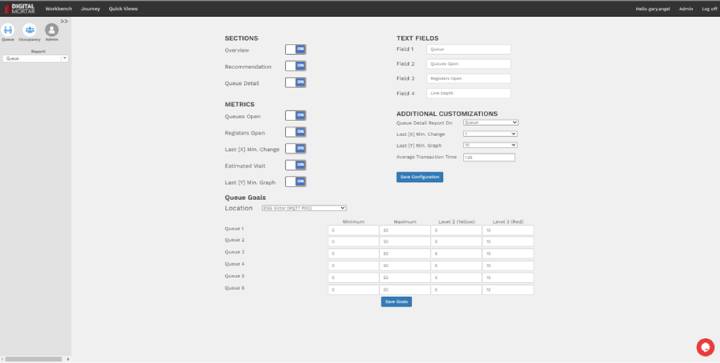
Queue measurement needs to turn into queue management to be useful. DM1 provides a full MQTT real-time feed with every queue metric. It provides a custom view builder for integration with digital signage and web. It provides a REST API with WebHooks. And, of course, it provides rich, customizable dashboards for both queue and occupancy of any and every area you define.
Only Digital Mortar can seamlessly integrate multiple technologies into our DM1 measurement platform. That matters. It matters because no single sensor can efficiently cover any environment. Camera is great for modest areas with reasonable ceilings. LiDAR can cover anything, but it really shines when you need precise coverage of large areas. And electronics? Electronics may be the only solution when you need reasonable information about cross-terminal visits.
Measure areas up to 1000 sq. feet with a single highly-reliable, camera – and matrix any number together for larger spaces. Great for even very crowded spaces. Optimized for counting. Able to provide full-journey. Stereoscopic camera is a robust, scalable cost-effective solution for most mid-sized area needs.
Any environment. Any ceiling type. Any mounting position. Great coverage with a small number of sensors makes for easier installation plans and more flexible coverage options. LiDAR in the right space can deliver better and more cost-effective measurement of large queues or areas with many sub-queues.
Electronic tracking comes in two modes. Tag-based for tracking labor and assets and open scanning for tracking Wi-Fi and BLE enabled devices carried by passengers. In its latter form, it allows you to track – at a high-level – a subset of your passengers in very long journeys (from parking to gate) with relatively little expense.
If you’ve ever worked with ANY people-measurement technology you know that while the technologies are great, none are perfect.
We’ve spent years working with each technology and we spend an inordinate amount of time working on ways to make the data better. Our three biggest tools: stitching, group detection and smoothing. Each is important to delivering you actionable queue management.
People-measurement solutions are quite good at identifying people and pretty darn good at counting line crosses. But crowds, lighting changes, unusual surfaces, carts, rollers, and wheelchairs can all cause problems. And these technologies tend to lose track of people and break their records – which can cause problems in counting and tracking full journeys. We’ve built sophisticated rule and ML-based systems for data cleaning and stitching. Systems that work in both batch and real-time and make Camera, LiDAR and Electronic data significantly better. And better data means better intelligence and better usability.
Groups matter when it comes to lines, especially in areas like ticket counters. Four people checking in together may be a longer transaction than one person, but it’s likely a lot shorter than 4. We recognize when groups enter a line and we can treat them as special entities for calculating wait times and making queue management predictions or setting alerts. Better group counting means better queue management.
Though camera and LiDAR both do a great job tracking people, they don’t always do a great job “holding” people – especially in crowds. That means records can blink in an out, creating quick and deceptive jumps in the data. Our stitching fixes most of those problems, but we also provide algorithmic smoothing – so you can report on period averages or most common values. It’s an especially important feature for good public signage and digital integration.
So much of queue management is focused on real-time operations it’s easy to forget how important deep analytics is. Our DM1 platform is, first and foremost, a powerful geo-location analytics platform that let’s you drill-down on data and understand exactly what happened.
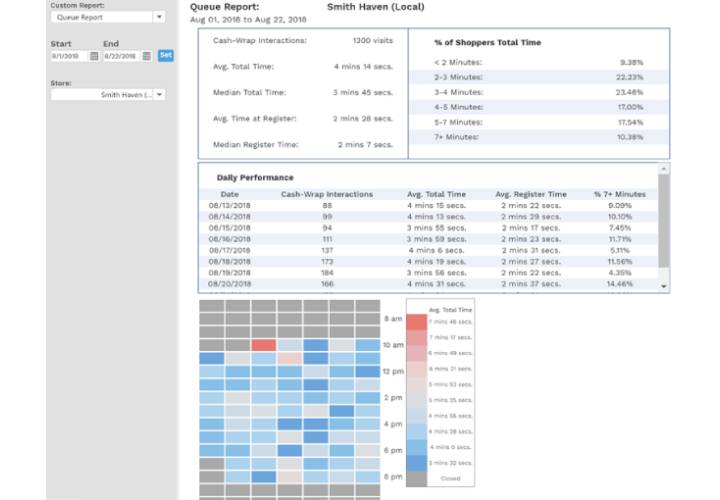
Understand individual queue performance. Processing station performance. Shift performance. Measure total time in lines. Study performance variation over time. DM1 provides a robust set of pre-built line analytics metrics that can help you find and diagnose operational problems. It also provides full feeds of the data in both realtime and batch so you turn loose powerful analytics tools like R and Tableau to do operations research.
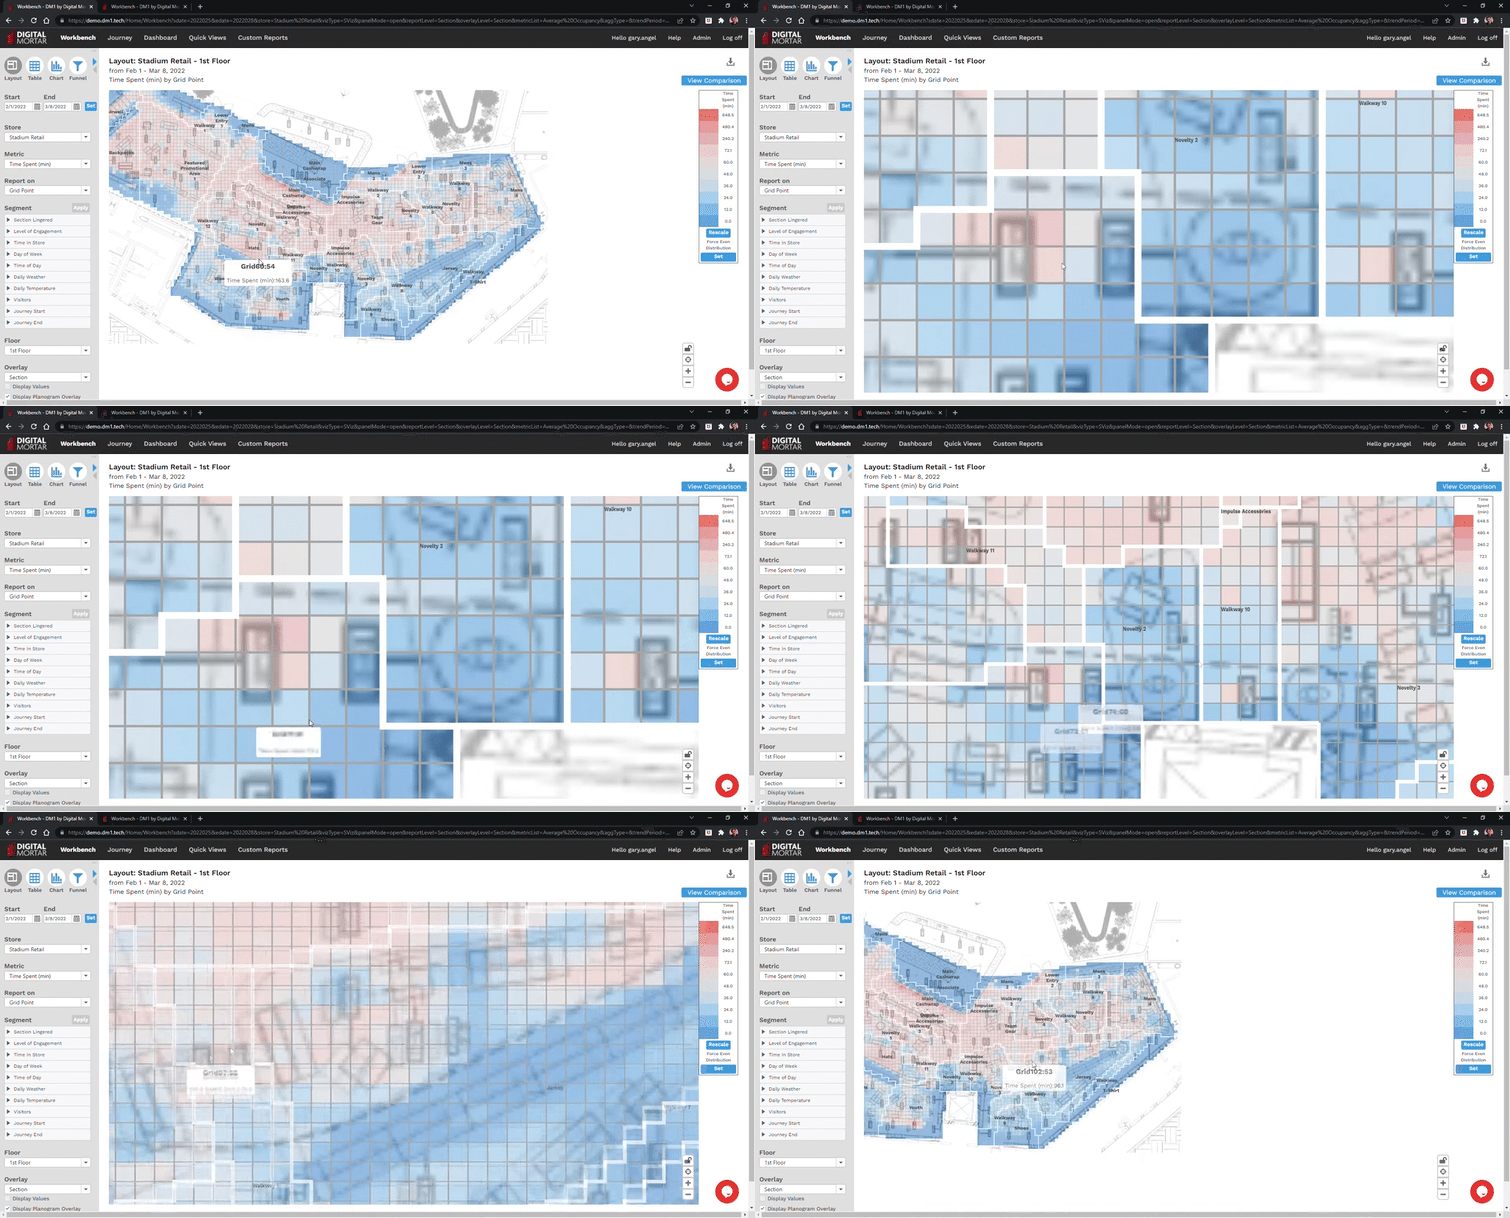
You’ve measured lines. Now maybe you want to do more. Whether it’s drilling down into retail, understanding and optimizing food service, tuning the customer experience on Entry or supporting detailed analytics on specialized services like lounges, our DM1 platform is optimized for full-journey measurement. Using the same technologies you already deploy for lines, we extend your analysis into new areas and new problems and deliver compelling operational insights that let you tune the experience beyond the line.
DM1 isn’t (just) a queue management solution. It’s a general-purpose people-measurement analytics platform. And its foundation is a powerful digital mapping tool that lets you map out any space and then use that mapping to control and drive people measurement and reporting.
You can have a single or multiple maps of a space. Maps can be configured at any granularity down to the square foot. Every map maintains a full historical state – so you can track performance in an area even if it’s changed dozens of time.
You can map sub-areas, stations, overflow areas and more. Map food-courts. Monorail stations. Ticketing and Self Check-In Areas. Retail centers. Waiting Areas. Easily and quickly. There’s no queue or space configuration DM1’s mapping tool can’t handle.
Every configuration is dated and tracked over time. That means you have a complete record of every change to the location and its impact on performance. That’s a godsend for operational research.
Both historical reporting and real-time instantly adapt to map changes. No re-processing necessary.
In complex Airport operations environments, integration is a key requirement. We provide every integration option you need in scalable, robust and easily ingestible form.
Get line and occupancy data for ANY and EVERY map-defined region or queue. With rich customization options including alerting, smoothing, stitching and even historical and change data. It’s the easiest way to ingest current queue data into your applications. Need turnkey public views? We provide a public view builder. A restful API. A full Alerting system. And even a good old-fashioned batch event level feed. It’s anything and everything you need to integrate queue data into your systems.
Our default delivery is Microsoft’s Azure Cloud. Single or Multi-Tenanted. But if you need on premise, we deliver that too. In high-reliability configurations that provide optional redundancy and failover in your Linux environment.
The best way to evaluate ANY enterprise software? See it in action.
Drop us a line and we’ll set up a time to walk you through DM1 and answer any questions you have.