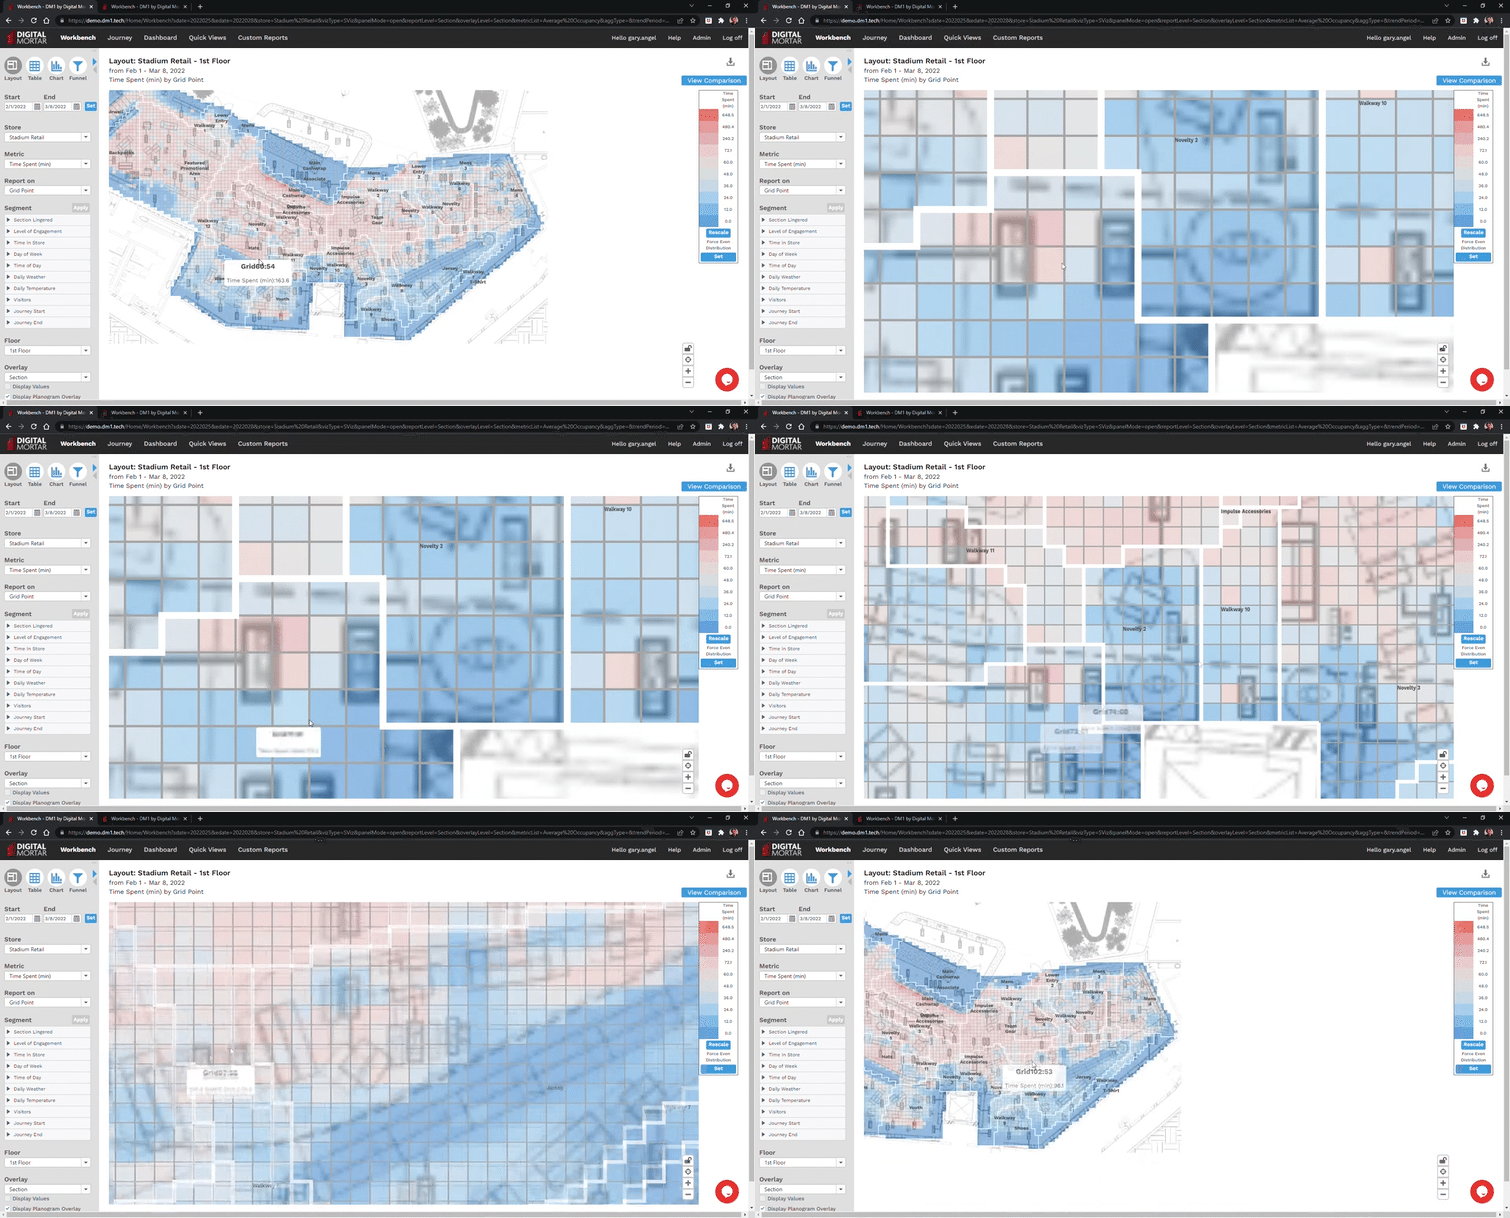
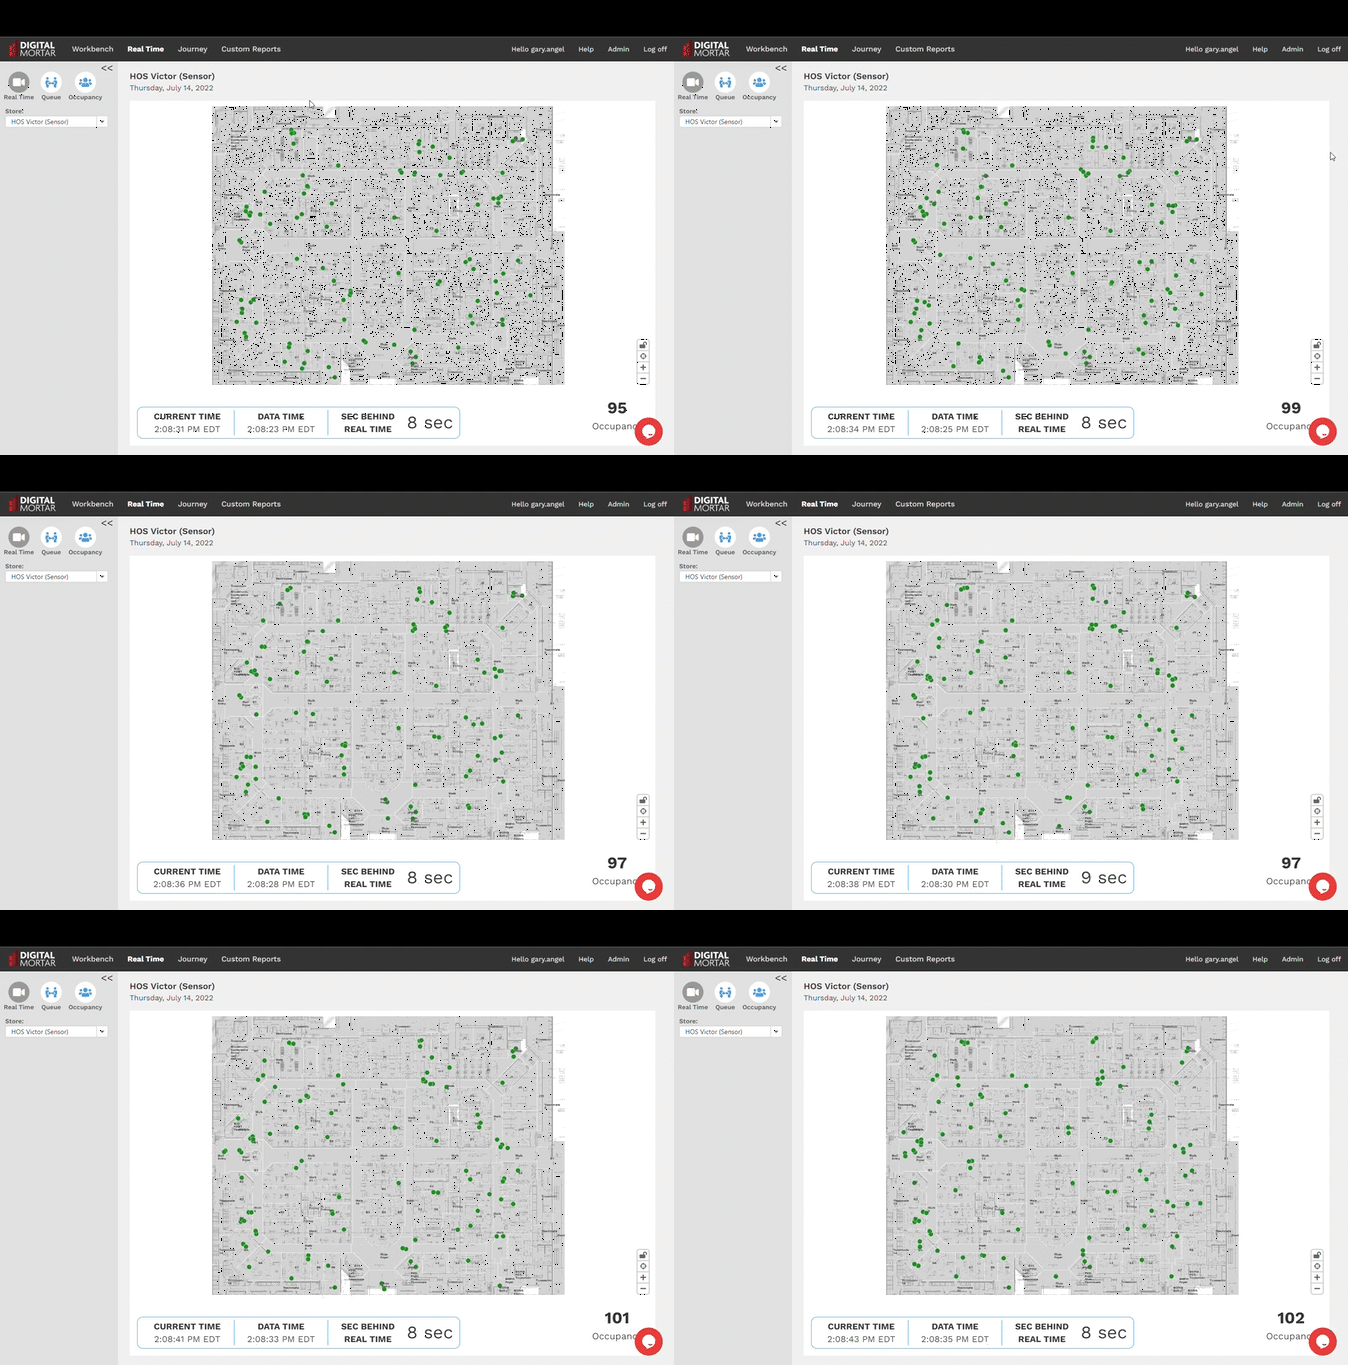
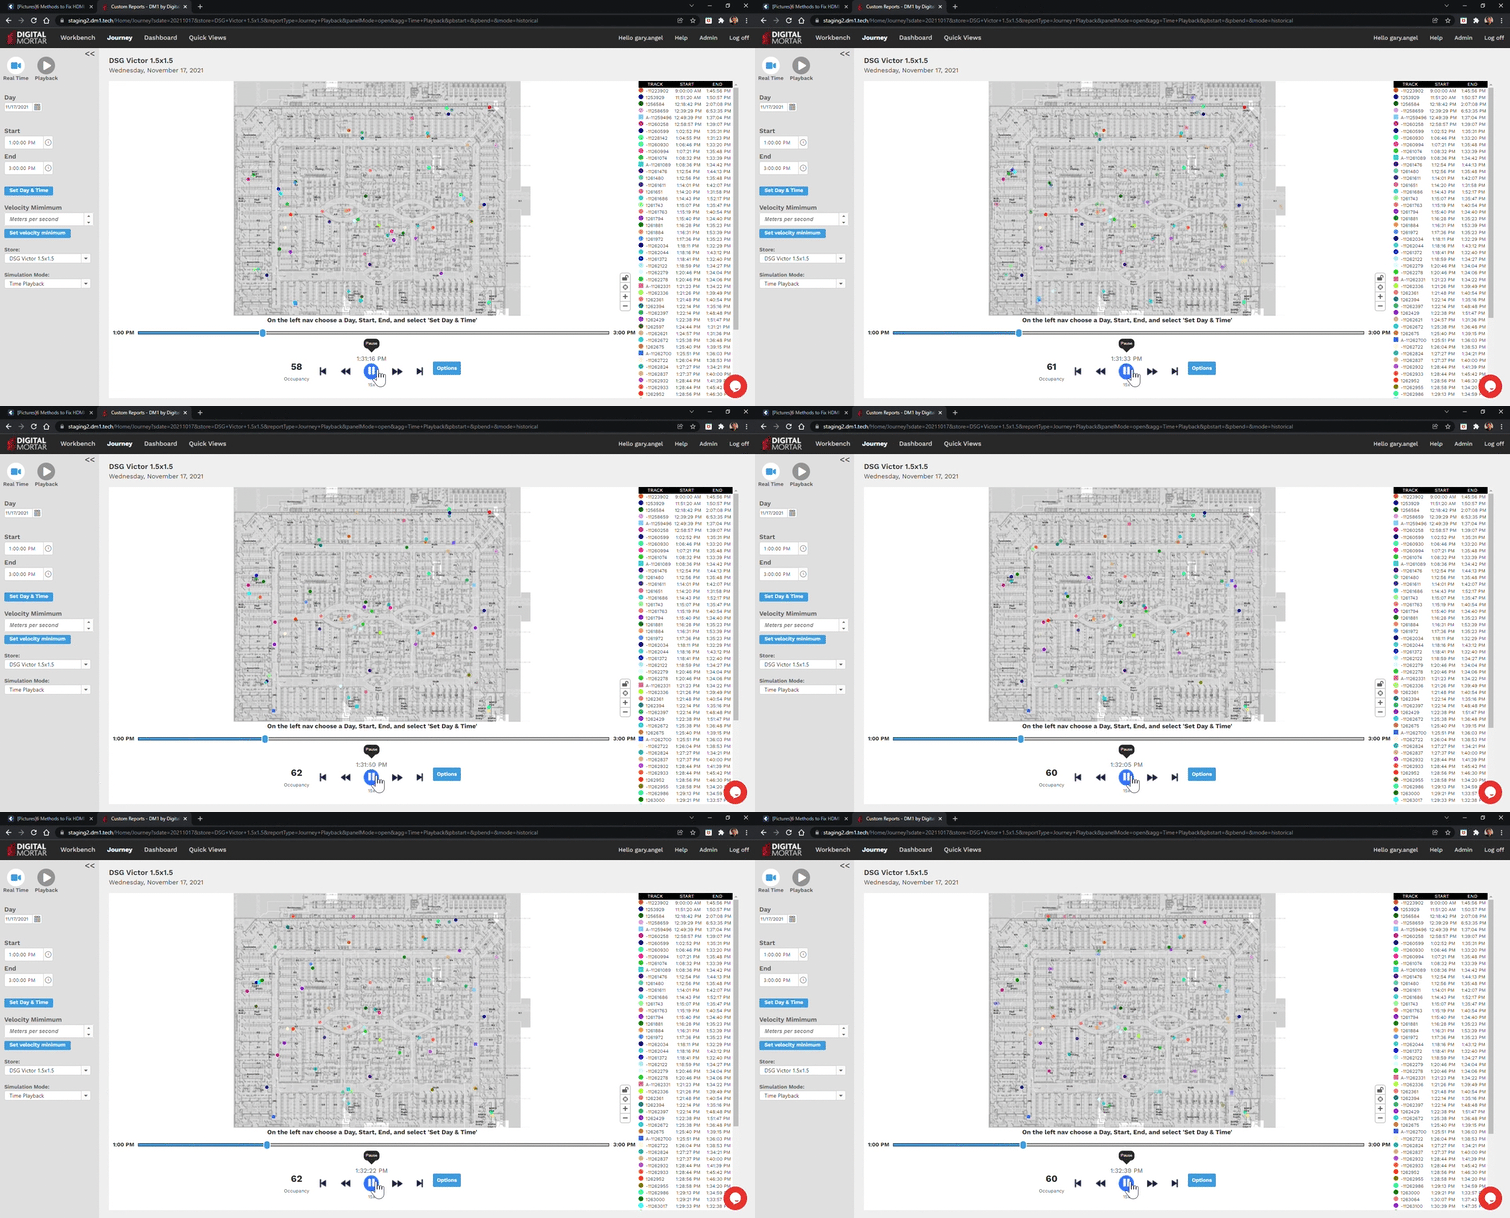
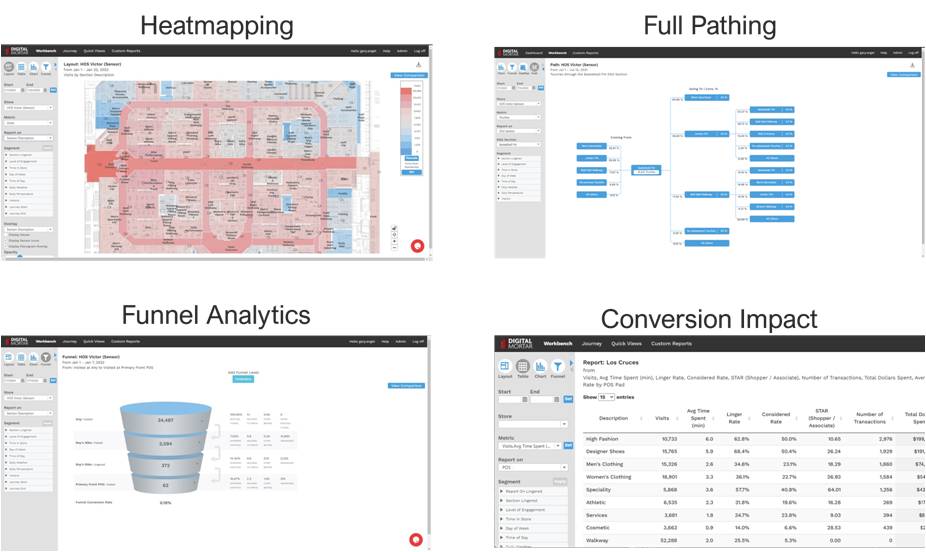
The shopper journey inside the store is incredibly complex and important. Every step and every second has value. So that’s what we measure. From door to floor to register. We measure every shopper. Every step. Every second. Against every purchase. In real-time and analytically.
That means you see and can act on what’s happening right now. Are lines at the Cashwrap too long? Is there a customer who needs help? Are Associates in the right place?
It also means you can analyze, understand and optimize every aspect of store performance: display engagement, store flow and design, detailed path to purchase, merchandising effectiveness, and Associate allocations.
We collect and analyze detailed shopper behavior using the best people-measurement technologies. Every shopper. Every step. We take the data from camera and LiDAR sensors and improve it with our advanced ML – performing complex stitching, Associate identification, and ghost & fragment removal. All to give you the best, most accurate, most comprehensive data in the industry.
Full journey means just what it says. You can literally play-back entire days of data. Follow individual shopper sessions. Filter by specific interactions. Measure time at every display or area. And track it all to what shoppers actually purchased.
Our real-time pipeline lets you monitor and drive store operations. Monitor lines & wait times at Cashwrap. View the Occupancy and STARs ratios in ANY area of the store. Identify shoppers in need of help. Track their interactions. Dynamically allocate Associates. It’s a fundamentally new WAY to manage the store.
The whole point of the store is to sell. We integrate POS at the individual level. That means we can tell you detailed path to purchase. Including the things shoppers looked at AND didn’t buy. You can track every display engagement. Every Associate interaction. Every path. All with a clear understand of what drove a sale and what didn’t.
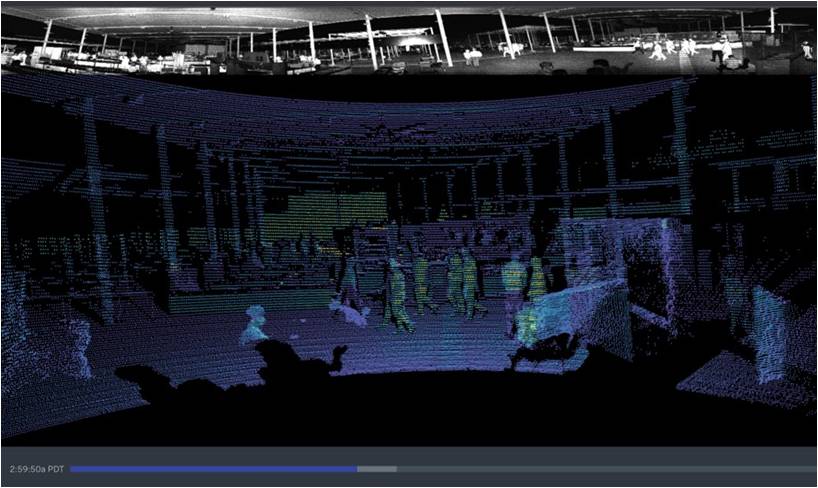
This is what the sensor “sees”. The IoT LiDAR and camera sensors we use can pick-out people moving through a space and then track exactly what they do and where they spend time. Twice every second. At square foot level accuracy. No video capture. No biometrics. No PII. Ever. Just full-journey behavior tracking to help you optimize the experience.
How can sensor provide full-journey tracking without identifying people? Sensors with overlapping fields of view track shoppers continuously across every part of the space. Nothing about a shopper gets tracked except what they did in your store.
That fine-grained tracking enables deep integration with PoS. We know who was standing in front of Register 104 at 3:13pm. That means we can match individual carts to individual journeys. So you know exactly what people bought and what they looked at and didn’t.
Most methods of identifying Associates are problematic. Visual badges? Terrible. Electronic badges? Compliance is a killer. We use the power of journey analytics to make those methods unnecessary. We classify Associates based on their tracked behavior. Who goes behind the Cashwrap? Who emerges from an Associate only area? It’s seamless, reliable, no-impact Associate identification.
Raw journey data needs to be contextualized to be useful. To do that, we map the journey data to a digital map of your store. After all, the difference between a shopper standing in Women’s Jeans or six feet away in Men’s Jeans is profound.
Mapping at the square foot level let’s us capture all the fine grained differences in behavior that matter, and extend measurement down to the display level. But we also let you seamlessly roll-up that data into increasingly broader scopes: from square feet to display to section to department to area to store. And at every level, you get the full journey analytics you need to drive continuous improvement.
You can map departments, sections, displays, experiences, functional areas, queues, and more. Create rollups so that reporting precisely matches the way your business works. Easily and quickly. There’s no space configuration DM1’s mapping tool can’t handle.
Every configuration is dated and tracked over time. That means you have a complete record of every change to the store and its impact on performance. That’s a godsend for operational research. For camera systems, we even create a library of daily images so you can visually compare setups over time and season.
Both historical reporting and real-time instantly adapt to map changes. No re-processing necessary. As soon as you update the map, your reporting is ready.
People-measurement gives you a direct snapshot into the state of the store. Right now. Our real-time pipeline lets you see whether lines are too long. Whether Footwear is slammed. If Associates are in the right places. It’s everything you need to drive operational improvement in the store.
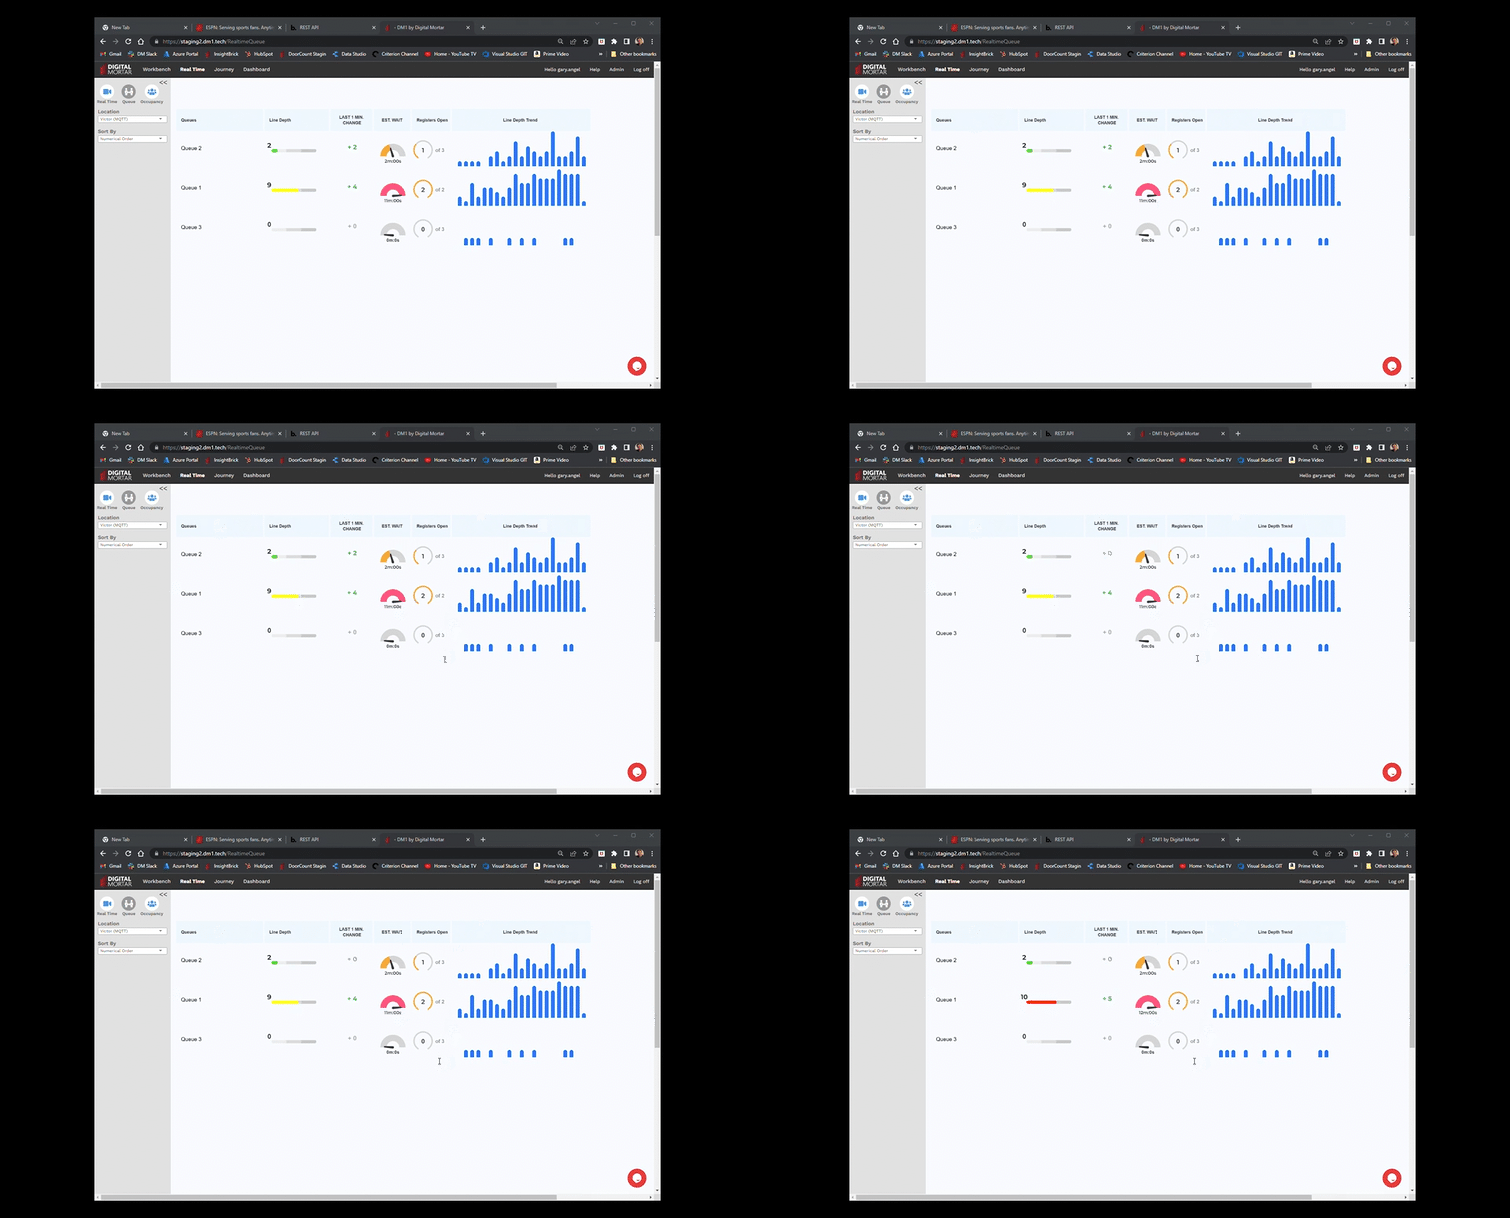
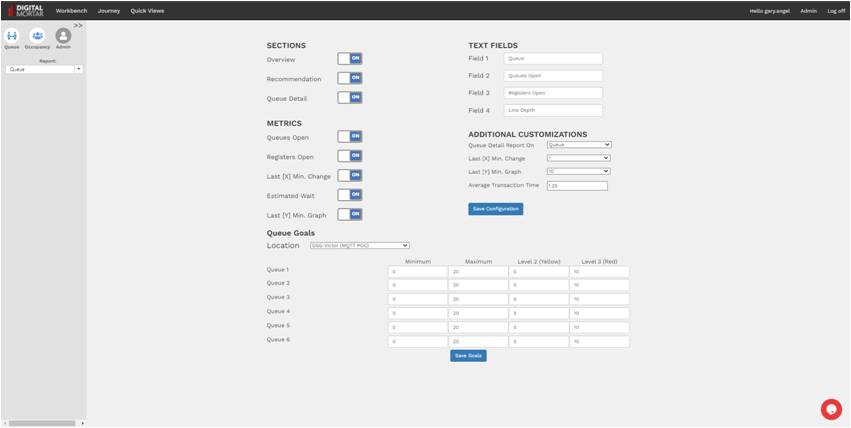
Monitor line-lengths and wait times across multiple cash-wraps. Track any style of checkout or customer support line. Generate alerts in real-time and integrated predictive models to facilitate management strategies.
Every section. Every display. Every area. As soon as you map it, you can track it. Occupancy. Associate Presence. STARS. Dwell Time.
Setup automated alerts based on occupancy, entrance, STARs ratios, interaction history, line times, and more. Then integrate those Alerts into your Associate Apps to make sure your Associates are always in the places where they can drive the most value.
We ingest the data, classify it, position it, clean it, identify Associates and deliver the output within seconds of real-time. This isn’t a raw sensor feed. It’s the entire toolkit of advanced people-measurement data cleaning delivered in real-time.
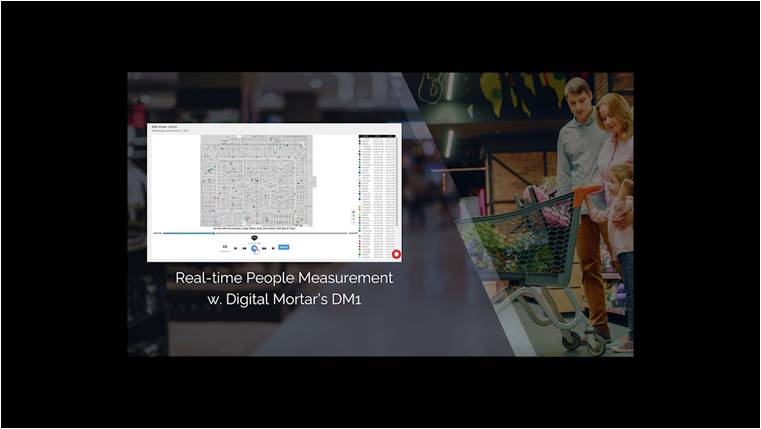
Load a full day of data. Then play it back at anything from 1x to 120x. Pause. Zoom in. Follow a single shopper session. Turn on trails to see navigational patterns.
Playback gives Corporate a detailed, real-world look at what’s happening in a store. How many Associates are on the floor. Whether they interact with shoppers. How long shoppers wait before getting help. Where shoppers go first. How they shop individual sections.
It’s an awesome tool for finding and fixing operational problems and understanding how the store actually works.
There is no store our platform can’t handle. We do people-measurement in places like the Hong Kong Airport and SoFi stadium. Size and crowds aren’t an issue. And no matter the space, you can load an entire day’s worth of data and play it back.
Playback doesn’t just re-create shopper movement on the floor. It visually separates Associates from Shoppers. It lets you turn and control journey tracks. Or follow an individual session. It’s a true research tool.
As you get into more advanced analytics, you’ll often find yourself asking “why” questions. Why isn’t this section busy. Why did traffic decline around this display? Sometimes, the best way to answer those questions (and explain what the answer means) is to look and show real in-store behavior. Playback lets you do that.
DM1 goes far beyond playback. It delivers powerful, journey focused analytics to help you identify store issues, make improvements, and monitor experimental results.
Tracking more than 50 journey metrics at data down to the individual square foot and up to every level of the store you’ve mapped, DM1 lets you drill into summarized store behavior down to the 10 minute level, to segment on shopper journeys to look at successful or failed outcomes, and to study paths and funnels for any group of shoppers over any time period over any collection of stores.
Usage, occupancy, average dwell times, conversion rates, STARs ratios, interaction counts, draws, exits, bounces and more. Get every metric at every level of the store for any time period.
Study every aspect of shopper behavior, conversion and store design. Where shoppers went. What engaged them. Whether they interacted with Associates. How their journey unfolded. What impacted sales. What didn’t. With our shopper-level PoS integration and full journey data, you get answers not just issues.
Measure STARS rates intraday by area. Study interactions and interaction strategies. Correlate to the impact on conversion rates. Optimize staff allocations and placements with data never before available.
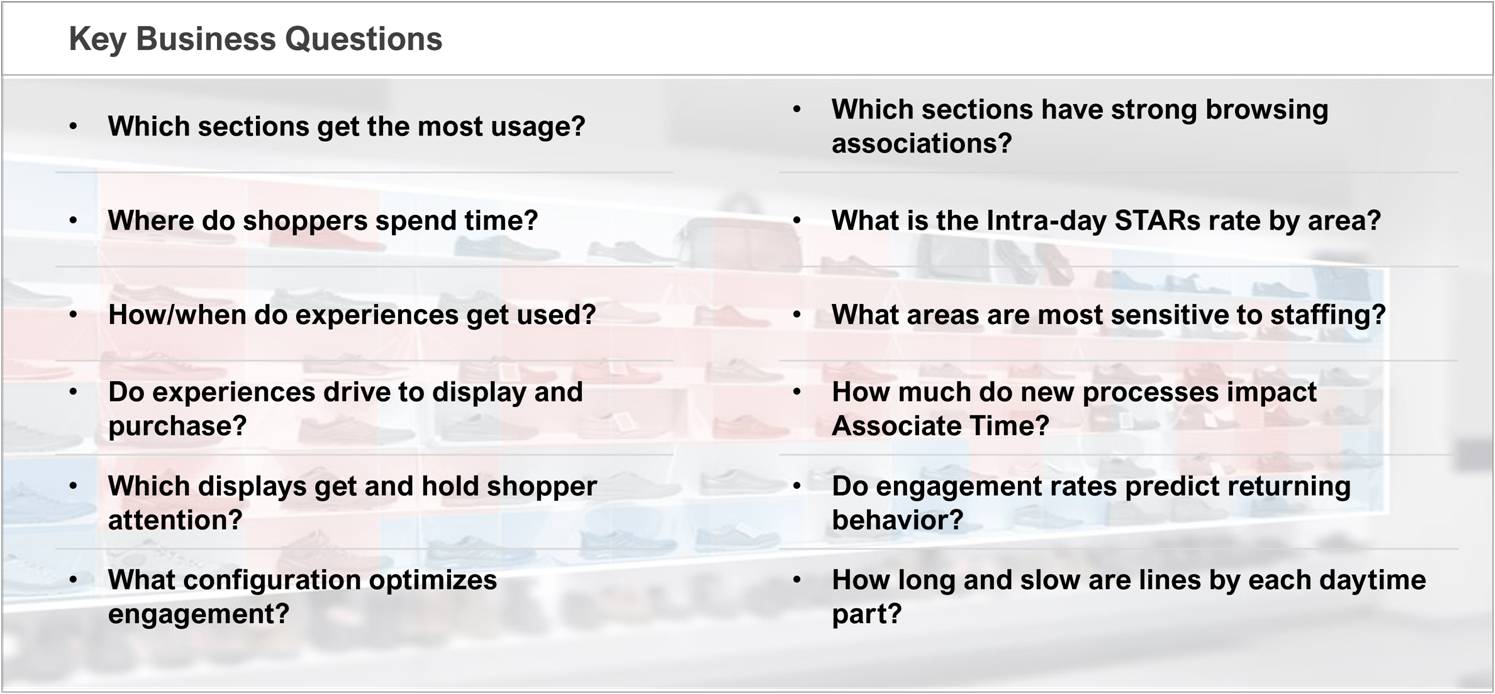
It’s not about technology or analytics. It’s about improvement. ROI. Change. With Digital Mortar’s DM1 full-journey analytics you get real-world answers to fundamental questions that matter to your business and your stores.
Every one of these questions can be addressed, right of the box.
In complex retail environments, integration is a key requirement. We provide every integration option you need in scalable, robust and easily ingestible form.
Get full journey data in raw, cleaned and stitched forms all in real-time. Add line and occupancy data for ANY defined map region – down to individual square feet. With rich customization options including Associate identification, alerting, smoothing, stitching and even historical and change data. It’s the easiest way to ingest real-time operational data into your applications. Need turnkey public views? We provide a public view builder too.
We provide analytic feeds direct to your data lake. Get our cleaned event level feed, our CRM feed at the visitor level, our store feed for Tableau-type reporting or our path feed for detailed path to purchase analytics. All included in the basic platform via API or SFTP.
Our default delivery is Microsoft’s Azure Cloud. Single or Multi-Tenanted. But if you need on premise, we deliver that too. In high-reliability configurations that provide optional redundancy and failover in your Linux environment.
Our DM1 platform provides almost every conceivable capability for retail people-measurement.
Every section. Every display. Every line. As soon as you map it, you can track it. Occupancy. Line length. Associate Presence. STARS. Dwell Time. Monitor in dashboards. Get the real-time feed. Setup automated alerts.
Load an entire day of data. Playback at up to 120x. Follow individual journeys. Filter on behaviors of interest. It’s your view into the store.
Track every shopper. Their path. What they looked at. What they didn’t. What they bought. Full path and funnel analysis. A special “path” API. And PoS data integrated at the individual Shopper level for the ultimate in answers.
Data in or data out. Integrate PoS data at the individual level. Get automatic weather data. Add labor details. Get every event, every path, every visitor, or every store via API or batch feed.
Monitor line-lengths and wait times across multiple cash-wraps. Track any style of checkout or customer support line. Generate alerts in real-time and integrated predictive models to facilitate management strategies.
Lines are a huge pain-point in retail. Nobody likes to stand in line. So making sure you do the best job possible in queue management is a key competitive advantage. Our queue management solution (also integrated directly into our full-journey measurement platform), provides a comprehensive solution for retail queue management that doesn’t require full journey measurement of the store. So it’s cheaper to implement and deploy to ALL your locations.
Measure occupancy or count enters & exits. Configure any line. Automatically track opening and closing of registers. Choose a cleaning algorithm. Set a smoothing technique. Add group detection. Track historical numbers even when areas change configuration. Set and customize alerts. Deploy predictive models. Publish custom views in digital signage and apps. Seamlessly and inexpensively.
Great Line Measurement Requires:
We integrate industry leading camera and LiDAR sensors from companies like Xovis, Hella, Quanergy and Ouster. Then we improve the data with advanced ML to remove problems and “stitch” tracks. The result is the BEST, most accurate, most detailed people-measurement data.
Configure any type of line in any type of space. Have multiple cash-wraps. Self-Checkout. Snake Lines? Customer Support lines? No problem.
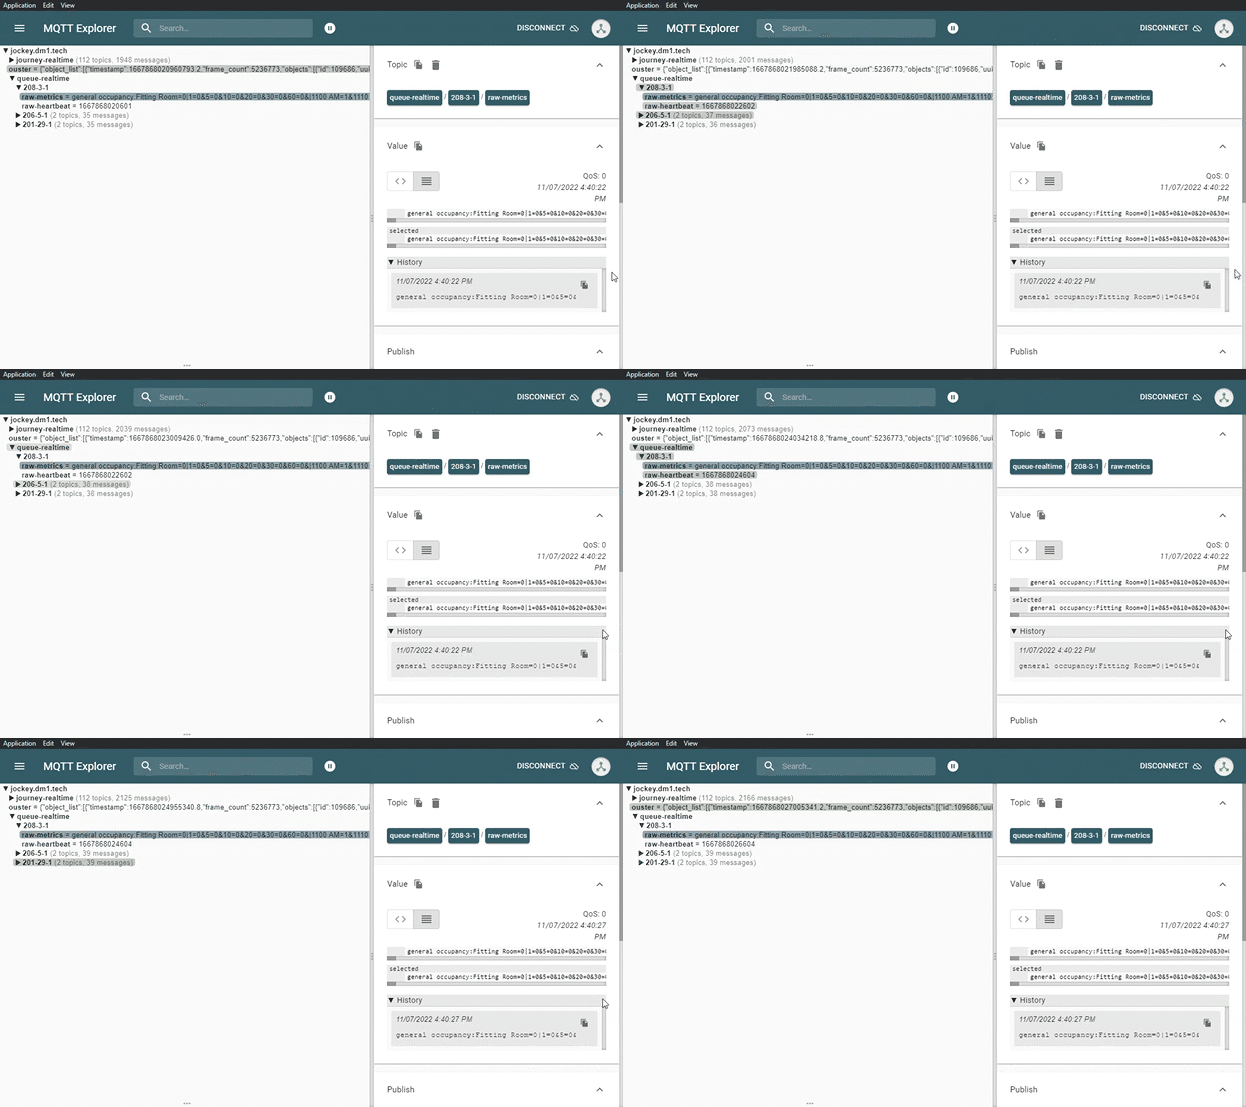
Queue measurement needs to turn into queue management to be useful. We provide a full MQTT real-time feed with every queue metric. It provides a custom view builder for integration with digital signage and web. It provides a REST API with Webhooks. And, of course, it provides rich, customizable dashboards for both queue and occupancy of any and every area you define.
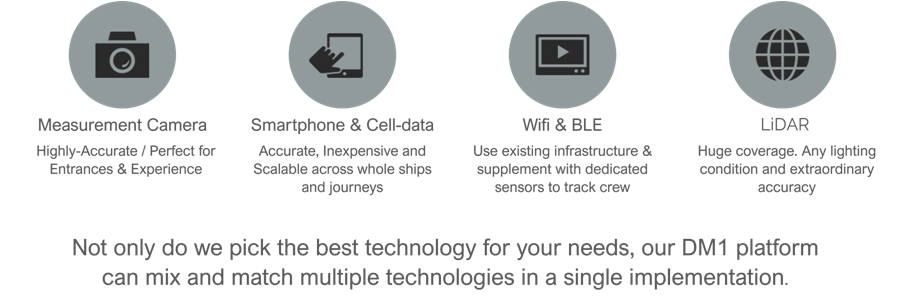
Only Digital Mortar can seamlessly integrate multiple technologies into our DM1 measurement platform. That matters. It matters because no single sensor can efficiently cover any environment. Camera is great for modest stores with reasonable ceilings. LiDAR can cover anything, but it really shines when you need precise coverage of large stores or areas. And electronics? Electronics can be useful for Associate tracking or tracking across malls or combined markets.
Measure areas up to 1000 sq. feet with a single highly-reliable, camera – and matrix any number together for larger spaces. Great for even very crowded stores. Stereoscopic camera is a robust, scalable cost-effective solution for most mall and High-Street stores and even many destination stores. It’s also a great solution for queue measurement or point measurement of high-value store areas.
Any environment. Any ceiling type. Any mounting position. Great coverage with a small number of sensors makes for easier installation plans and more flexible coverage options. LiDAR can deliver better and more cost-effective measurement of large stores, large combined queues, and even indoor-outdoor combined environments (drive-throughs, pickup areas, gas pumps, etc.).
Electronic tracking comes in two modes. Tag-based for tracking Associates and assets and open scanning for tracking Wi-Fi and BLE enabled devices carried by customers. For most stores, we don’t recommend electronic tracking. However, it can be useful in mall and market environments.
If you’ve ever worked with ANY people-measurement technology you know that while the technologies are great, none are perfect.
We’ve spent years working with each technology and we spend an inordinate amount of time working on ways to make the data better. Our three biggest tools: stitching, group detection and Associate detection. Each is important to delivering you actionable people measurement data.
People-measurement solutions are quite good at identifying people and pretty darn good at counting line crosses. But crowds, lighting changes, unusual surfaces, carts, and wheelchairs can all cause problems. These technologies tend to lose track of people and break their records – which can cause problems in counting and tracking full journeys. If you’re full journey tracking isn’t good, then every metric you use will be broken. We’ve built sophisticated rule and ML-based systems for data cleaning and stitching. Systems that work in both batch and real-time and make Camera, LiDAR and Electronic data significantly better. And better data means better intelligence and better usability.
Groups matter when it comes to shopping and queue management. Four people checking out together may be a longer transaction than one person, but it’s likely a lot shorter than 4. We recognize when groups enter the store, section or line, and we can treat them as special entities for calculating occupancy, wait times and making queue management predictions or setting alerts. Better group counting means better analytics and better operational management.
We can do Associate detection via electronics, but our preferred method in full-journey implementation is behavioral. We track when somebody goes behind the cash-wrap, uses an Associate door, or goes into an Associate-only area. And we categorize and track them appropriately. No special compliance. No extra cost.
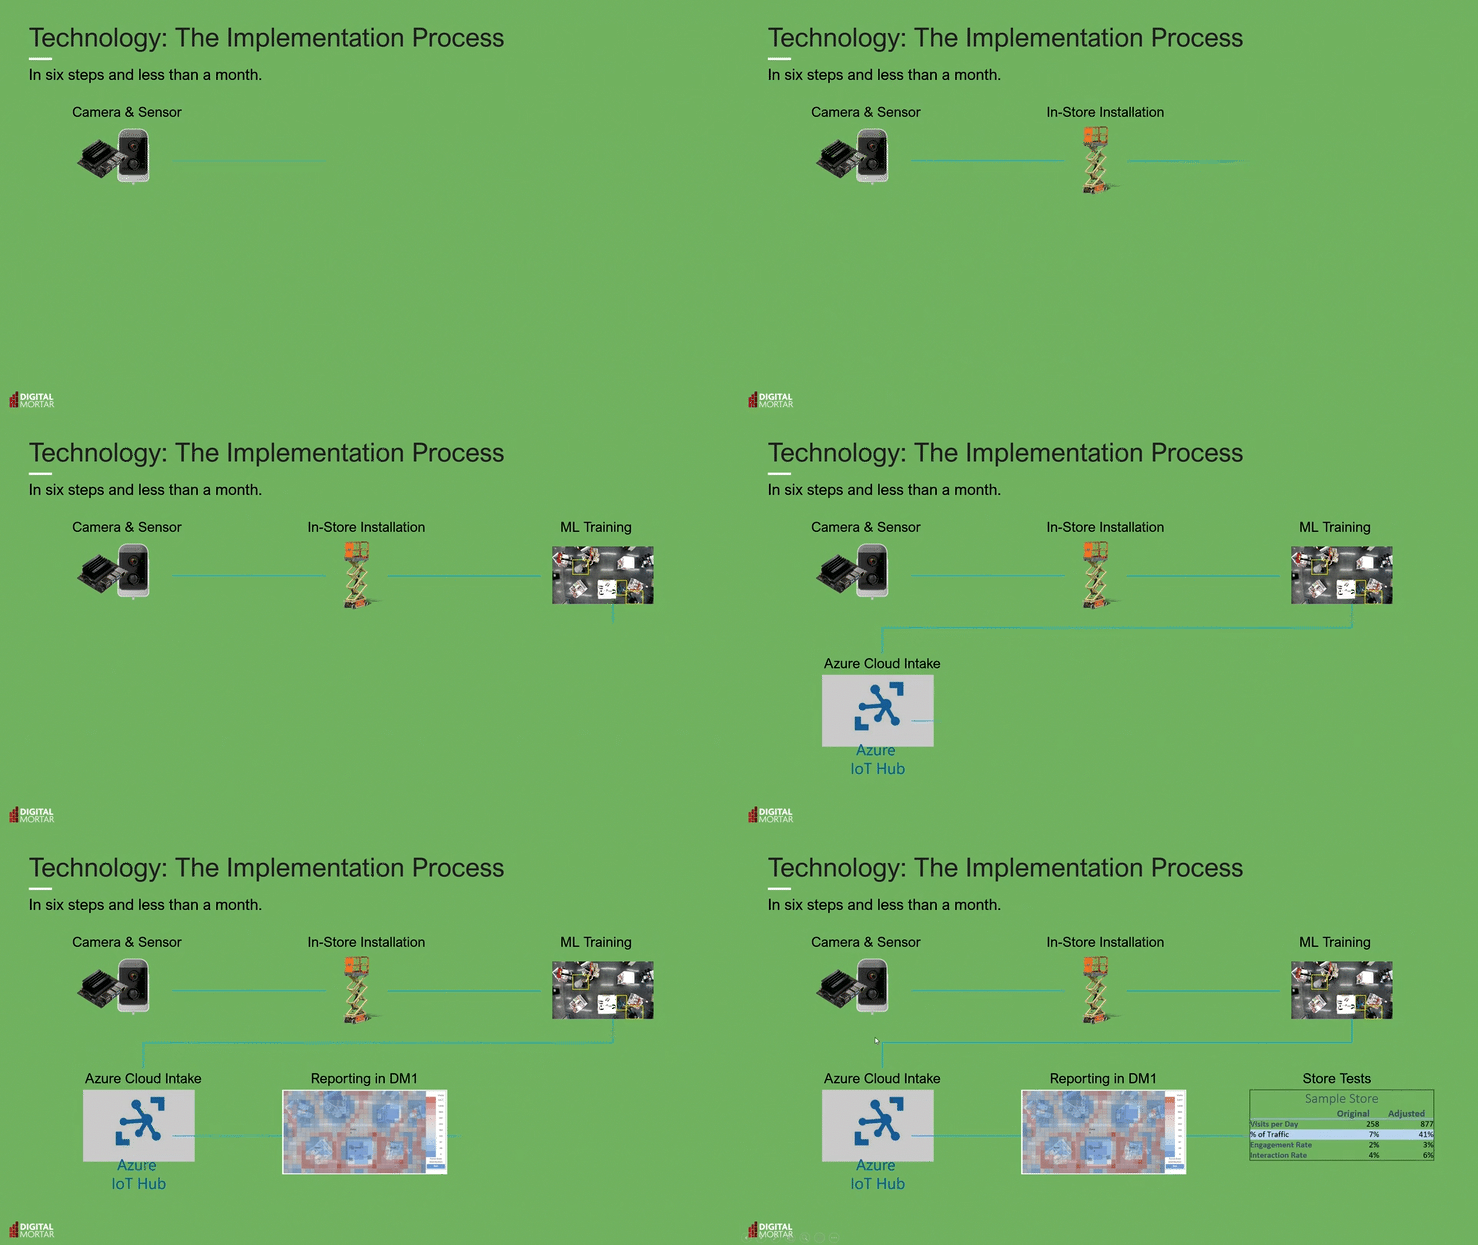
We’ll help you every step of the way. From putting together a truly thoughtful hardware plan (making sure you get the most efficient sensors for your space/requirements), planning the implementation, provisioning the hardware, working with your installation teams, calibrating the system, creating the integrations, and getting your key people on-board.
We typically provide a comprehensive solution. Hardware, cloud-based software platform, integration and even – if desired – analytics services. But feel free to buy hardware direct, integrate existing supported sensors, rely on your data-lake, or even go fully on-premise.
You don’t have to dive into comprehensive journey tracking or kit out your full fleet. We recommend comprehensive measurement in a small set of “test” stores. And we provide self-contained capabilities for door-counting, occupancy, real-time, line management, and display optimization that don’t require large hardware investments. So you can right level your investment and grow as you learn.
The best way to evaluate ANY enterprise software? See it in action.
Drop us a line and we’ll set up a time to walk you through DM1 and answer any questions you have.