
DM1 takes your data and makes it come alive.
What Shoppers do?
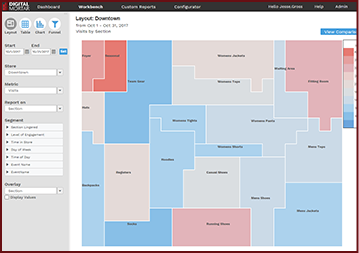
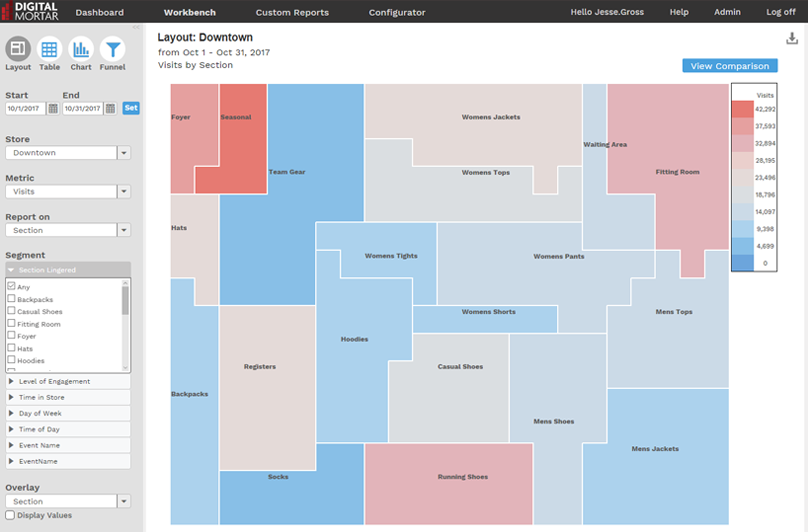
Store Layout
What works best?
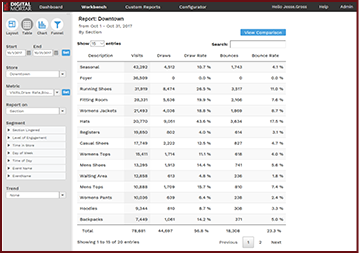
Store Table
How it’s trending?
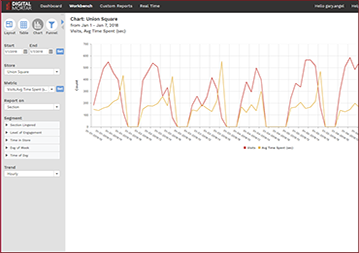
Chart
How do we do that? Great reporting isn’t
about numbers, it’s about context…
Visual
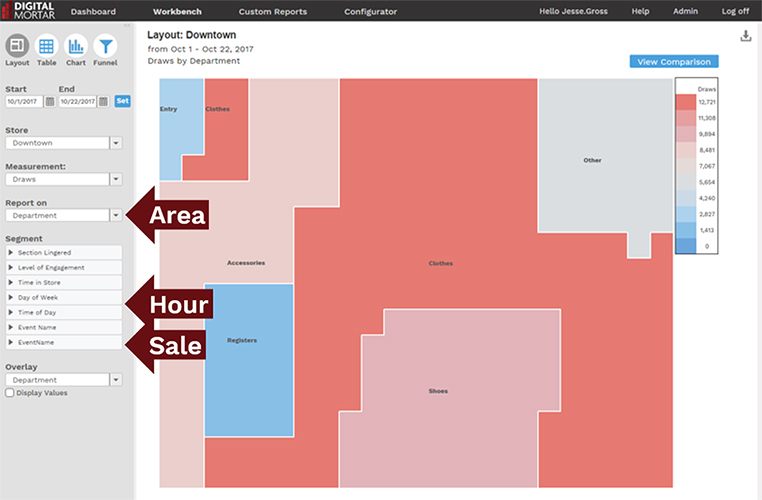
DM1 maps every shopper measurement to the store.
Every data point we track is contextualized based on where it occurred in the store. This is heatmaps – re-imagined. Re-imagined in ways that make it easy to see how any area of the store and how any level of the store performed. Re-imagined to make it easy to see what changed and by how much. Re-imagined to make understanding and explaining customer journey data massively easier.
It’s about matching the data to the decisions you need to make
Flexible
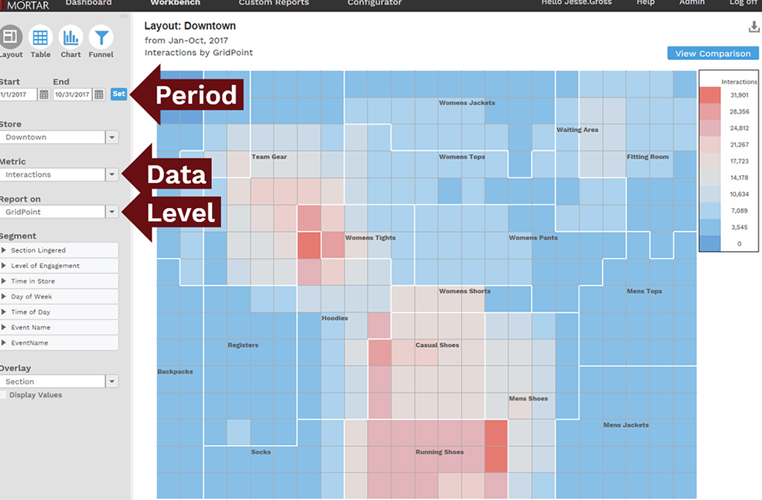
Any Store Level: From department to section right down to display. DM1 lets you measure performance for any part of the store at any level you care about.
Any Time Period: Report on ANY date range to capture true seasons, the week before Halloween, or key event days. DM1 never limits your ability to get at the data you need.
Any Data: Mix and match metrics to get all the information you need in a single shot. Mix and match shopper metrics, store performance and Associate data to get the view you want.
With the flexibility to zero in on what you care about most.
Detailed
DM1 lets you drill-down into the critically important details that always end up being the difference makers. With DM1, you can:
- Get ANY metric for ANY store-level: from individual displays to entire stores
- For ANY time-period you define: from a single day to a specific season
- By ANY day-time part: any hour of any day
- Visualized or trended down to 10-minute increments
- It’s the power you need to answer the questions that matter
And DM1 makes it easy to figure out what changed and what matters.
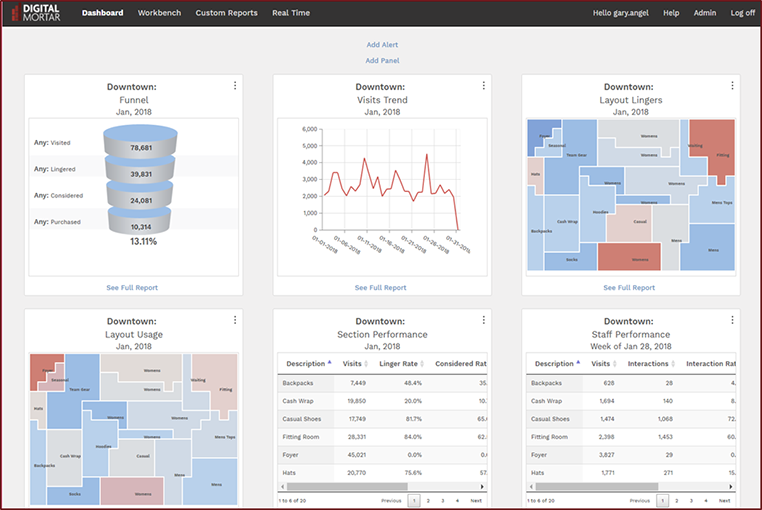
Focused
Your store had a fantastic week. Or maybe it tanked. The question in most reporting is simply: what changed?
DM1 builds automated alerting into your customizable dashboards so you can shortcut long, laborious analysis and go straight to optimization.
Have a KPI you always want to see? DM1 provides always-shown KPI alerts.
Only want to see something when it changes significantly? DM1 provides "Percent Change" alerts for ANY metric.
Are there thresholds that drive interest? Do you want to know when a conversion rate falls below a certain level? DM1 lets you set threshold alerts too.
Focused, automated intelligence.
Which lets you move from reporting to
action.