Associate Measurement in Retail Stores
Associate Measurement in Retail Stores
By Gary Angel
|December 14, 2021
Measuring Associates is a critical part of good store measurement. First, because understanding which person is an Associate and which is a Shopper is necessary to measuring Shopper counts accurately. Failure to distinguish between Shoppers and Associates will result in significant overcounts of shoppers. Significant overestimates on visit times, significant miscounts on STAR’s ratios, and significant undercounts on conversion metrics. In other words, it bollocks up everything. The second argument is utterly different – it’s that measuring Associates is interesting and useful on its own. Especially these days where store operations are changing dramatically.
How do you measure Associates? In one sense it’s easy, Associates are people and people-measurement systems will track them just like anyone else. Thirty-frames a second with high-positional accuracy.
But how do you know they are Associates?
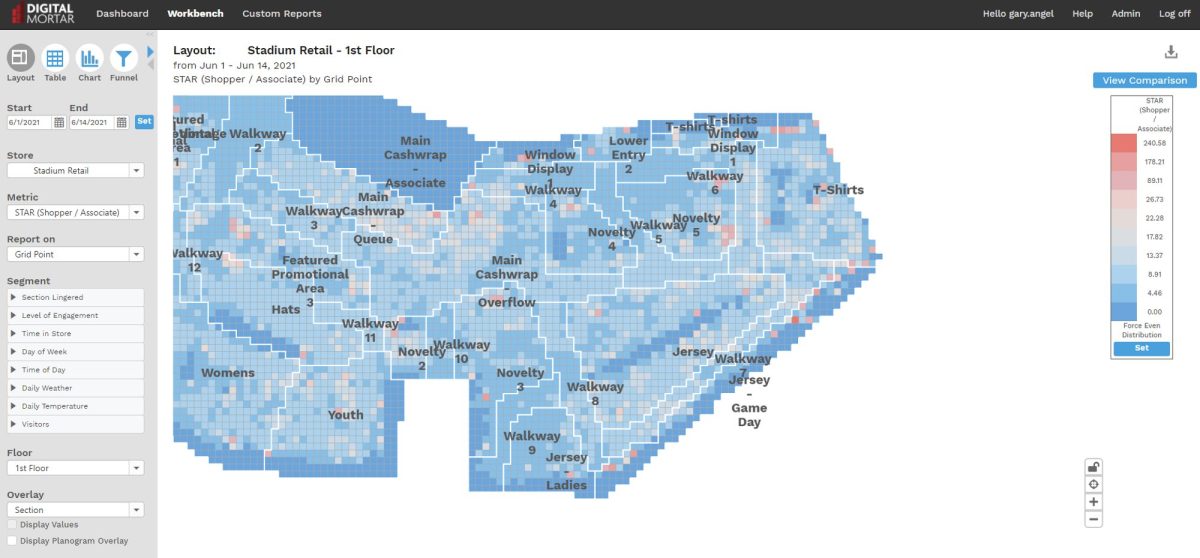
One way is to electronically badge each Associate. The second method is to use pre-defined Associate Areas in the store and behaviorally flag Associates. This second method is cleaner, simpler and cheaper. To do it, the first step is to mark Associate only areas and doors on the digital map of the store. Areas behind cashwraps are obvious. But it’s also very important to flag service areas and every door that leads to an Associate only area – breakrooms, stockrooms, etc. With that flagging in place, our DM1 platform will identify any record that spends time in one of these designated areas or uses one of these doors as an Associate. And it will flag anyone stitched to that record as an Associate. Even backwards in time. With full sensor coverage of a store, DM1 can track people for extended periods of time. Measurement systems do sometimes lose track of people – but with stitching logic, it’s not unusual to track people from door to door. If your associates are pretty regularly on and off the floor or in an Associate only area, you’ll get VERY robust associate tracking and shopper/Associate differentiation with no extra hardware, no extra compliance, and no extra cost.
It’s not perfect (in shopper measurement nothing is) but in many retail environments is a surprisingly effective Associate measurement strategy.
Measuring STARS
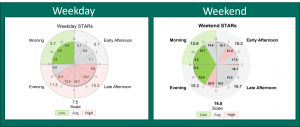
Shopper to Associate Ratio (STARs) is a key metric for most retail stores and it’s the first metric people use when they’ve implemented Associate detection. A while back we posted on a visualization, the STARs Clock, that showed STARs rates vs Area Conversion by Hour and shift. It’s a great viz that packs a lot of information into a very consumable format. But that post didn’t discuss the somewhat complicated issue of how, exactly, to measure STARs.
STARs doesn’t seem complicated, and in its most common form, it isn’t.
STARs has traditionally been calculated as Doorcount / # of Employees in a given day. If you had 700 shoppers in a day and 10 workers, your STARs rate is 70. Easy.
But not very useful. Because this number hides all the important detail. Like what the STARs was when the store was busiest. Or what it was like in an individual section.
One of the really cool aspects of measuring shoppers and Associates in detail is that you take measurements like STARs and drive them down to fine-grained levels of detail. That means you can know, for example, what the STARs ratio was for the 10 minutes between 2:15 and 2:25pm on Saturday in the Footwear department.
As a metric, though, this opens up a bunch of questions. If you measure STARs by hour for a section, what exactly are you measuring?
It could be a lot of things.
You can use time, visit or occupancy rates for shoppers and Associates – you can even mix and match. It’s a surprising tricky metric when you move it from the store day level to finer grained levels of both time and store.
Suppose a store Section had 50 shopper visits in an hour, 25 of those shoppers spent a significant chunk of time in the section, the time they spent added up to 200 minutes, the most shoppers that were in the area at any one time was 10 and if you slice the hour up into minutes, the average number of shoppers in the area by minute was 3. In that same hour, 5 Associates entered the area. 4 spent a significant chunk of time in the section. The time they spent added up to 50 minutes. The most Associates in the area at any one time was 3. And if you sliced the hour up into 1 minute chunks, the average number of associates present in the area was 1.5.
- Would you say the STARs rate was 50 / 5 or 10 (Shopper to Associate Visits)?
- Or would you say that Engaged Shoppers to Significantly Present Associates
- is better (25 / 3) or about 8?
- You could use total Time spent. That’s 200 minutes / 50 minutes or 4.
- Or Max Occupancy, which would give you 10 / 3 or a 3.3.
- If you took the Average Occupancy, you’d say the STARs rate is 3 / 1 or 3.
In other words, depending on how you wanted to calculate STARS, the number would range from 3 to 10 and hit almost any value in-between.
None of these answers are right or wrong. But they aren’t quite the same thing either. We think the raw visits counts are the least interesting and least representative measure. Total Time is fairly reflective and resistant to outliers but doesn’t necessarily capture spikes. The average occupancy method is a nice compromise that represents both spikes and actual shopper experience more closely. It tends to get at a number close what a human eye would expect to see when entering a section during that hour.
There is no commonly accepted definition because most people have never had this kind of information. They are still working at the door/day level where none of the interesting stuff is even accessible. At some point, people will home in on standard definition – just as there came to be an accepted definition of visit in the digital world. It doesn’t make it right and it doesn’t mean there aren’t reasons to think about other ways of doing it – that might be better at capturing peaks or valleys – but it does make it a little easier to understand!
Key Labor Metrics
Some Shopper Metrics are also relevant to associates – but some just aren’t. If STARs is the first metric people use from Associate detection, what other types of Associate metrics are interesting?
Like shopper measurement, a lot of Associate metrics are all about where Associates are and how long they spend in different place. On the other hand, a shopper metric like Visits isn’t very interesting for Associates. For shoppers, we say they visited a section if they spent any time in that section. But a similar measure for Associates isn’t very interesting – having an Associate just pass through an area isn’t very interesting. Similarly, time-based measurements of engagement are meaningless for Associates
Instead, we tend to focus on total Associate time in an area and Associate Occupancy. Time by area and time on floor are both important. Area and section time help you figure out labor allocations and measure compliance with those allocations. All too often, Associates aren’t in the areas assigned.
At a higher level, the ratio of floor to back-office time is increasingly important as Associates get more non-Customer tasks. It’s also an important measure to see if various new technologies designed to support store tasks are having the desired impact.
These are all high-level metrics, but with fine grained Associate measurement you can do more detailed analysis. One particularly interesting metric is interactions. You measure when interactions happen, how long an interaction takes, how long a shopper spends in the store or area before an interaction happens, how many interactions a shopper has, how often an Associate is interacting with shoppers and even how much conversion those interactions drove.
Interaction Metrics
It takes people to run a store. Even with increasing levels of automation, stocking and checkout require people. But figuring out how many people you need to run checkout and stock the store isn’t rocket science. The real trick when it comes to labor is figuring out how many Associates you need working the floor. Using the STARs (Shopper to Associate Ratio) in conjunction with section level conversion rates to figure out the optimal level of staffing is a natural place to start. STARs is a great big picture metric, but interaction measurement provides a set of metrics that are more fine-grained and let you home in on potential problems, staffing compliance, service strategies, and even real-time dynamic staffing allocations.
When you’re measuring Associates and Shoppers at one foot level accuracy at thirty FPS, it turns out to be pretty straightforward to see when shoppers are interacting with Associates. DM1 does this by defining a proximity zone designed to capture conversational distance and then looking for instances when shoppers and associates share that zone. The basic metric get extended by distinguishing between static and moving interactions. Cases where Associates are moving with shoppers are indicative of extended interactions over product and product finding. Interactions can be measured as both a count and an amount of time.
Doing this kind of basic interaction measurement yields a rich set of metrics starting with interaction count. You can take the interaction count by section and compare it to the shopper visit count and various counts based on level of shopper engagement (lingers and considers). This tells you what percentage of shoppers to an area had an interaction and what percentage of engaged shoppers had an interaction. Cross-tabulating these percentages against conversion rates helps determine how impactful interactions are on performance.
You can also cross-tabulate interactions with Associate metrics to derive measures like interactions per hour and the amount and percent of time Associates spend interacting with shoppers. Metrics like these can help you understand whether having increased Associate presence makes a difference and measure differences in associate performance.
Finally, you can cross-tabulate interactions with shopper journey performance to refine your understanding of Associate impact and help tune interaction strategies. This kind of measurement opens up unique experimental strategies. Since you’re measuring journey, you can measure the differential impact of interactions based on when they occur in the shopper journey relative to section and store entry. This works by measuring the average time to interaction from entry for each section where an interaction occurs. Knowing how long a shopper has been in an area without an interaction can even be used as a real-time trigger to direct Associates where to go. Dynamic allocation strategies are the next phase in store operations – taking analytics deep into the tactical realm.
It’s that ability of Interaction metrics to drive so many analytic and operational improvements that make this one of the most exciting and important types of people-movement measurement.