Mapping and Contextualization in People Measurement
Mapping and Contextualization in People Measurement
By Gary Angel
|July 17, 2023
Lidar is becoming the go to technology for people measurement applications, combining accuracy, precision, privacy and excellent real-time performance. To make lidar sensors work you need two kinds of purpose-built software. Perception software (which translates the raw point-cloud from a lidar sensor into objects/positions) and a People-Measurement Platform that ingests that data, cleans and contextualizes it, and then provides intelligence, reporting and distribution services.
In my last post, I described the data quality and cleaning functions that live in the Foundational layer of a people measurement platform. No part of a people-measurement platform is more important. If the data sucks, nothing else matters. And without the data cleaning and stitching in a people-measurement platform, the data will suck.
But once you have usable data, the other part of that foundational layer – mapping – becomes critical. In its raw form, people measurement data is just a timestamp, a random track identity, an object classification (person, car, etc.), and a position. That’s it.
This mean anything to you?
12332, 6-28-2023 14:23:01.30,88,107,unknown
12332, 6-28-2023 14.24:05.30,92,111,person
12332, 6-28-2023 14.26:05.30,89,114,person
12332, 6-28-2023 14.29:05.30,22,13,unknown
That’s a sample of what the raw data from a typical lidar track will look like. With this data, all you really know is that someone was in a location and how quickly they moved through it. To make the data meaningful, you need to map it.
Mapping the data can turn that same data into this:
Womens Jeans, 64 Seconds
Womens Tops, 120 Seconds
Womens Jeans, 180 seconds
Cash Register
That’s a lot more illuminating. It’s the mapping that makes geo-location data sing, and it’s critical that mapping live in the people-measurement platform.
That’s true for a couple of reasons. First, mapping is actually pretty complex for reasons I’ll take up in a moment. That means mapping functionality is hard to build on your own or in tools like Tableau. Second, every use of people-measurement data requires mapping – so it just makes sense for it to be done once at the foundational level. Third, mapping is one of those things that if you do it downstream, various sources will disagree in ways that are subtle, have an impact on metrics, and are extremely hard to track down. Mapping requires a single source of truth.
In our DM1 platform, one of the biggest and most complex tools is the digital mapping tool. In this tool, you can create locations of any size. Set the smallest unit of measurement (typically 1 square foot but we’ve done grid sizes ranging from 6” to as much as 3 meters.
You can then map business names on any shape in the store. You can have as many separate mapping regions as you want and they can be any size. Nor do they have to be contiguous. If you have Women’s Sportswear in 2 different locations, you can create two separate mapping areas or a single – even if they are on separate floors.

With this basic digital map, every tracked event is classified as belonging to an underlying area with a business-specific name. And it’s this mapping that lets the people-measurement platform build meaningful metrics and track journeys in a way that yields insight.
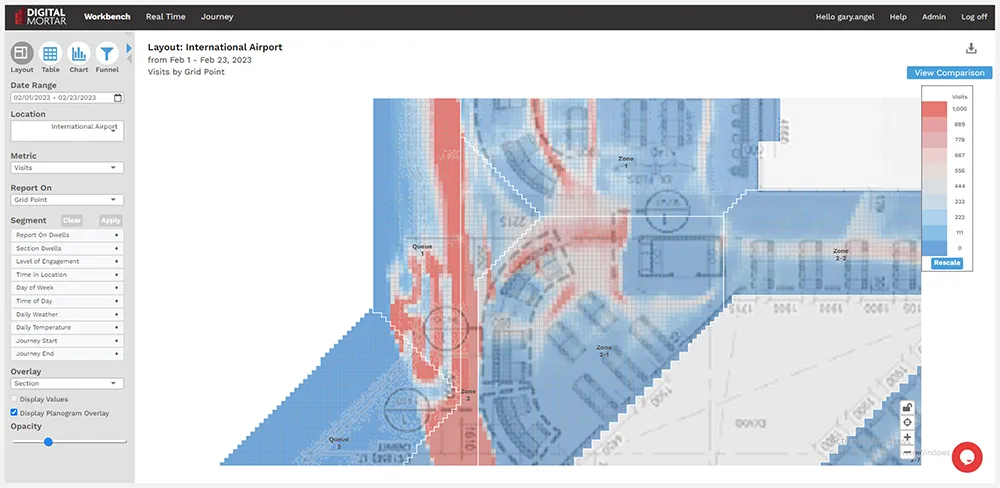
You should be able to map any kind of space at any level of detail:


For robust mapping, though, this kind of one-to-one mapping can be quite limiting. You might want to report at the display level, the section level, and the department level. Or, for a train, you might want to report at the seat, the car and the train level. A mapping capability needs to support this kind of hierarchical reporting structure because it’s common to almost every people-measurement application.
To do it, the platform should provide a meta-data capability to create hierarchical structures in the data:

In this case, the client has built roll-ups of their lowest reporting unit to Departments, Sections and Gender. That means every event is tracked to the lowest mapping level and to every hierarchical unit above that level. The people measurement platform can simultaneously track how much time the person has spent in the section, the department and the gender category. All totally configurable so that the same underlying capability can work for an airport as well as a retail store.
DM1 lets you define these roll-up categories and there are no limits to how many areas you can define and how many roll-ups you can have. I think the most roll-ups we’ve ever seen is 8 or 9, but it’s normal to have 2-4.
But what if you want to define two fundamentally different views of the space – views that aren’t hierarchically related? There are a lot of times when that makes sense, and a people measurement platform should support that as well.
In this case, the client wanted to create special queue areas for overflow and occupancy tracking but not impact the division of the space by shopping area. To do that, they simply created an alternative map:

Data is automatically charted in every active map.
Even this, however, isn’t enough. The biggest problem with mapping isn’t creating a map. It’s that the layout of physical locations changes. Especially in retail, what’s where in the space may change in a substantial way 4-8 times a year and there are often small changes on a weekly basis.
To handle this, a people-measurement platform must support historical mapping – keeping track of the state of the space for any defined data during which data is collected.
It’s this changeability, more than any other aspect of mapping, that is hard for non-specialized tools to handle.
Of course, this isn’t just a mapping capability. Saving maps by applicable date range isn’t all that hard. The really hard part is making sure that whenever you run a query, you are always using the right map for each event. One way to do that is to store the mapping in place at the event level, but that turns out to be a terrible idea. It’s just true that spaces often get changed and then the tool gets updated afterward. If that happens and you’re storing the mapped range in the physical event, you have to go back and re-process all the data. What’s more, you often want to create special regions and mappings for analytics purposes. But those will never have been present in past data.
The solution is to map each event as a query executes. That allows the query to always use the most correct maps for any date – even if the map was updated after the data was captured. It also allows an analyst to create new mapping configurations and use them against data collected at any time in the past.
That’s pretty cool, and making this capability performant may be the single biggest challenge a people-measurement platform has to solve.
Mapping is just fundamental to people-measurement. In our DM1 platform, we use the mapping everywhere. It’s used to drive every query. It’s used to control the analytic heatmapping. It’s used to control data quality processes like stitching. It’s used to drive metric calculations and define specialized areas like queues. And, of course, it gets attached to data distributions in both real-time and in APIs and data feeds. Because, of course, all your uses of people-measurement data OUTSIDE the people-measurement platform will need the results of this mapping capability!
Which is a great transition point, because in my next post, I’m going to tackle that distribution layer and what a people-measurement platform needs to do to help integrate this data into the rest of your operations and analytic software stack.