Visualizing and Optimizing the Store as a Funnel
Visualizing and Optimizing the Store as a Funnel
By Gary Angel
|June 8, 2017

Visualizing the customer journey in the context of the store is the foundation for analyzing in-store data. The metrics and the store context provide a framework for translating customer measurement data into something that is immediately understandable as a shopper’s journey. But visualizing information is just the first step in making it actionable. Understanding the data is, of course, essential. But you can understand data quite well and still have no idea what to do with it. In fact, that’s a problem we see all the time with analytics. And while it’s a problem that no technology solution can solve entirely (since there are always business and organizational issues to be tackled), there are analytic and reporting techniques that can really help. We’ve built a number of them into DM1, starting with in-store funnel analytics.
The idea behind a conversion funnel is simple. The customer journey is chopped up into discrete steps based on increasing likelihood to purchase. If we analyze the journey by those discrete steps, we can work to optimize the flow from one step to the next. Improve the flow between any funnel step and the next, and the chance is excellent that you’ll improve the overall funnel conversion as well. Funnels give you a specific place to start. They let you figure out which parts of the overall customer journey are already working well and which aren’t. They let you focus on specific areas with the confidence that if you can improve performance you’ll make a significant difference. And they make it possible to easily measure success. All you have to measure is the number of people moving from one step to the next.
Funnels are THE paradigm for analytics and optimization in eCommerce. In fact, it was largely on their ability to help merchants understand and improve eCommerce funnels that digital analytics solutions first gained traction. And to this day, eCommerce testing and analytics practitioners almost always work by breaking down the customer journey into funnel steps and then working to optimize each step. While the measurement of funnels is itself interesting, I think the real value in funnel analysis is the process it supports. That ability to target specific aspects of the journey, figure out which ones are the most broken, and then test possible improvements is at the heart of so much of the continuous improvement that makes digital players successful.
One of our big goals with Digital Mortar is to bring the in-store funnel paradigm and the discipline of continuous improvement to the store. DM1 delivers on the technology and analytic part of that program.
Here’s how DM1 couples the funnel metrics and funnel visualization into one flexible and powerful funnel analytics tool.
With DM1, you can start a funnel at any place in the store and at any stage in the customer journey. But the most natural place to start is with a shopper entering the store. As you can see, DM1 lets you choose any area of the store you’ve defined and lets you pick from a range of engagement metrics.
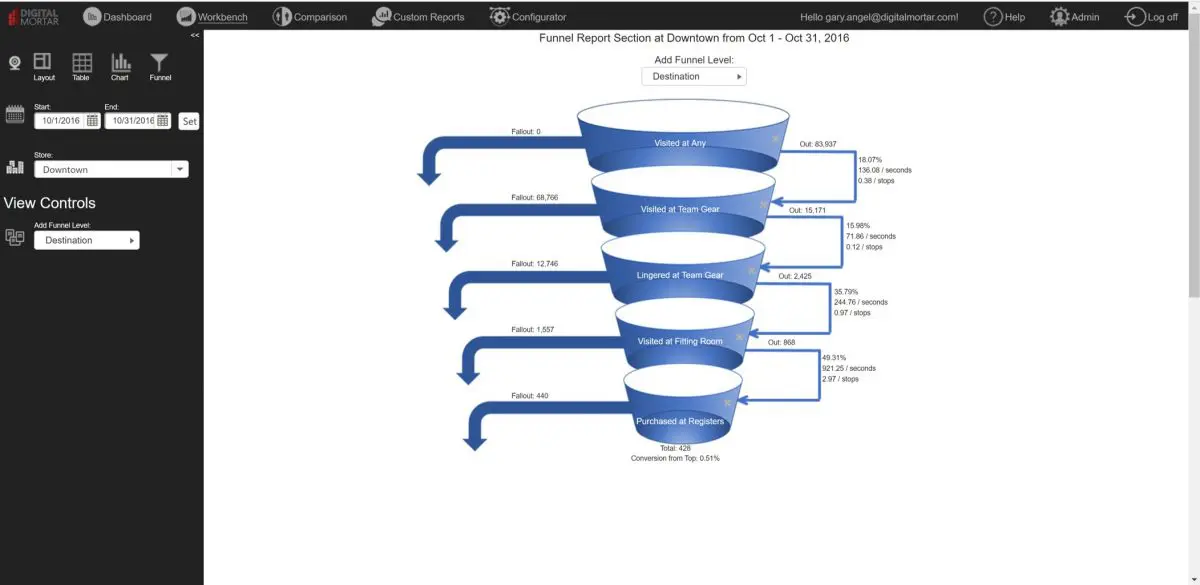
Nearly 84 thousand shoppers entered the store in October. Since that’s where the measurement starts, this first step of the funnel doesn’t have any fallout. Everyone I measured, by definition, entered the store. It’s worth noting – and I get asked this a lot – that you CAN track pass-by traffic if you setup the measurement system appropriately. Doing so allows you to extend the funnel outside the store!
I co

I want to know how many people SHOPPED in Team Gear out of the folks who had the opportunity. And I can see that by selecting Lingers as my metric in the next funnel step. These last two steps illustrate a powerful metric in store measurement that’s simply never been available before. Stores have been able to measure conversion (checkouts/door entries) at the macro level, but at the area level this gets reduced to sales per square foot.
That isn’t reflective of the real opportunity a square foot provides. By measuring where shoppers actually WENT and where they SHOPPED, we have a real KPI of how well a section is performing given its opportunity.
Only about 1 in 7 shoppers who passed through Team Gear actually Shopped there. That’s a problem I’d probably want to tackle.
From here, I can add Fitting Room and CashWrap to the funnel. At every step along the way I can see how many shoppers I’m losing from the total opportunity. I can also see how much time is passing and how many stops the shopper made in-between.
In the end, I have a customer funnel for Team Gear that runs from Store Entry to Cash-Wrap that looks like this:
Any start place. Any level of engagement. Any steps in between. DM1 builds the funnels you need to support analytics and testing.
Pretty cool.
There’s no doubt in my mind that the picture of the shopper journey that DM1 provides drives better understanding. But as I said earlier, analytics isn’t improvement. It’s a way to drive improvement.
The funnel paradigm works less because of it’s analytics potential than because of the process it helps define. In-store funnels focus optimization efforts and make them easily measurable. Whether I tackle the step with the highest abandonment rate, try to build the initial opportunity, or attempt to remove distractions between key steps, funnel analysis helps guide my reasoning about what to test in the store and provides a fully baked way to measure whether store changes drove the desired behavior.


