Seeing into the Soul of the Shopper
Seeing into the Soul of the Shopper
By Gary Angel
|June 13, 2018
The integration of behavioral research and Voice of Customer is remarkably fruitful. I saw that first hand in a project we recently completed with our partner Insight Safari for a top 10 retailer in the United States. For the project, Insight Safari’s research teams fanned out across the country and did shopper interviews at stores in markets like Pittsburgh, Dallas, and Los Angeles. This is deep qualitative research – designed to get to the emotional core of shopping decisions and see how attitudes and intent shape in-store behavior. It’s what Insight Safari does. But this time there was behavioral twist. Shoppers were given a mobile device with Digital Mortar’s tracking built-in. And at the end of the journey, the survey giver was able to tailor the survey based on a detailed map of exactly what the shopper had done.
Integrating a behavioral view into an attitudinal project enriches the project immeasurably. But it’s not trivial to do and there’s a reason why Insight Safari is uniquely well-positioned to do this. To understand both the challenge and the opportunity, a little background on voice-of-customer and behavioral analytics is necessary.
VoC and Behavioral Analytics
Voice of Customer research usually tries to capture four key elements about a shopper. Who the shopper is (demographics), what the shopper did (behavior), why the shopper did it (drivers), and how the shopper felt about it (satisfaction). One of the things that makes opinion research an art is finding the right balance between each of these. And there’s always an opportunity cost – any time you spend in one category inevitably reduces the amount of time you spend in another. Beyond the opportunity cost, though, it’s particularly challenging to disentangle a shopper’s description of behavior and drivers. Ask a shopper why they came to the store and then ask them what they did, and the answer they give to the first is highly likely to influence the answer they give to the second. What’s more, the shopper is prioritizing the shopping session by their internal measures of what they did – they forget the distractions, the things they looked at but didn’t buy, and the places they went that turned out not to be important. But if you’re the store – understanding those failure points is what you’re really after!
Many of the shopping sessions that we tracked with Insight Safari lasted 30 minutes to an hour. Think about that. How likely are you to be able to say what you looked at and explain how you navigated a store over that amount of time?
Insight Safari sometimes hires a videographer to (literally) stalk the shoppers and record sample journeys in the store. But that strategy falls victim to its own kind of quantum uncertainty – the act of measurement alters the system dynamics too much. We’re all used to having a phone in our pocket – but unless you’re a Kardashian, having a videographer following you around just doesn’t feel natural.
It turns out that of the four primary types of data collection for VoC, understanding what the shopper did is actually the hardest to get right with self-reporting. There’s an amusing anecdote we like to tell from our days in digital analytics. One of our clients had a very negative satisfaction score for internal search sessions (super common for various reasons ranging from the type of sessions that use internal search to most internal search engines being really crappy). Interestingly, though, when we actually integrated their online survey data to their behavioral data, we found that almost a third of the visitors who complained most about search on the site hadn’t actually “searched”. We were asking about internal search – typing in keywords in a little box – but they were thinking about “searching the site and not finding what they were looking for”.
What’s more, we found that for a significant percentage of visitors, their self-reported site visit reason just didn’t square with their actual behavior. A shopper might report that they were in the store to pick up clothes for the kids, but spend nearly all their time in the beauty aisle. It’s not that shoppers are lying about their behavior. Mostly they just aren’t objective or reflective about it. But getting through those layers of thoughtlessness is hard – sometimes flat out impossible. And getting even a remotely accurate approximation of the shopper’s behavior takes deep, detailed questioning that inevitably chews up a lot of time (opportunity cost) and leaves the analyst wondering how accurate the behavioral account really is.
So imagine if instead of having to interrogate the shopper about behavior – did you do this? What about this? Did you look at this on the way? Did you stop here? Did you go down this aisle? – you could just SEE their behavior. Every twist, every turn, every linger point!
Suddenly you’re not guessing about shopper behavior or the accuracy of self-reporting. You can focus the interview entirely on the why and the satisfaction of the experience. And you can use details of the behavior to call back elements of the journey to the shopper’s mind. What were you looking at when you stopped here? Why did you go back to the electronics department 3 times? What made you turn down this aisle?
It’s powerful.
But it’s not as easy as it looks, either. And in understanding why this is a little harder than it seems illuminates what makes Insight Safari particularly able to take advantage of the Digital Mortar behavioral data.
The Biggest Challenge Integrating Behavioral Data into the Survey Process
Voice of Customer data runs the gamut from highly quantitative (large sample sizes, standardized surveys) to fully anecdotal (guided focus groups). There’s interesting work to be done at any place along this spectrum and Insight Safari customizes the research approach to fit the business questions in play. But their specialty and primary focus is on going deep into shopper motivations and psyche – and that’s best done in the more personal, anecdotal end of the spectrum. At the same time, they like to have enough data to infer how common core shopper motivations are and how likely those are to play out in a given store. So Insight Safari usually works in the range of hundreds of surveys – not tens of thousands like we did in digital analytics and not 5-10 like a focus group company.
Most companies who take hundreds of surveys, rely on quite a bit of standardization in the survey design. Each shopper essentially takes the same survey with minor deviations for branching.
This sucks for a variety of reasons. Unless you know specifically what you’re looking for, it’s likely to miss the interesting parts of most shopper’s journeys. And if you’ve ever worked with this kind of data, you know that it’s almost certain to raise issues that leave you wishing you’d been able to ask one more question to really understand what the shopper was thinking! It can be frustrating!
But a rigid survey design also means that the behavioral data isn’t mapped into the questioning process. It can’t be – because you don’t the behaviors in advance. So while it’s possible to compare, for example, stated visit intent with actual shopping behavior, you aren’t using the data to drive the questions.
Insight Safari doesn’t work that way. Their survey givers aren’t part-times hired the day before to hang out in the store. They use research professionals – the equivalent of full-on focus group leaders – who are deeply knowledgeable about survey research. So their survey isn’t a rigid framework but a kind of loose framework that ensures they collect like kinds of data from each shopper but leaves the giver free to delve into interesting answers in great depth.
That turns out to be perfect for integrating behavioral data.
When shoppers finished their journey, the survey giver would enter the survey respondent id on their iPad and then get the detailed break-down of what the shopper did. Right then. While they were talking with the shopper.
And Insight Safari’s pros seamlessly integrated that into the flow of questions – even using the path visualization to directly explore decisions with the shopper. Most companies just don’t use survey givers skilled enough to do that. That’s no big knock. I’m not skilled enough to do that. Being able to drive intelligent field research takes an unusual combination of people skills, empathy, and objective analytic prowess. You have to be able think fast, be nice, and listen closely. It’s the equivalent of having no prep-time and still being able to do a great interview. Not easy.
There are ways to take the behavioral data and create survey integrations that are more mechanistic but still capture much of the uniqueness of the shopper journey. But there aren’t many companies who could take this time of in-store behavioral data and integrate it as deeply and seamlessly into their process as Insight Safari.
A Little About the Software
We customized our system pretty extensively for Insight Safari. We build a small mobile app (Android-based) that had a really, really simple user interface to it. The survey giver just had to press a button to start a survey and, when the phone was returned, press the stop button to end recording. The App pinged out every 2 seconds with the shoppers geo-location and included the survey id. We store that information in our real-time database. The shopper never has to do anything with the phone or app. They can carry it or it was attached to their cart.
The App also created a local store of the information in case there were connectivity problems (we had a few but not many). This allowed the App to send the survey data whenever connectivity was restored.
When the survey giver got the phone back and pressed Stop, the phone sends a message to the server and the session is closed. Once it’s closed it’s immediately surfaced in a custom report in the DM1 platform showing the most recent surveys completed.
The survey giver can search for any previous respondent, but almost never has to do that. They just click on the most recent survey closed and get the detailed behavioral report.
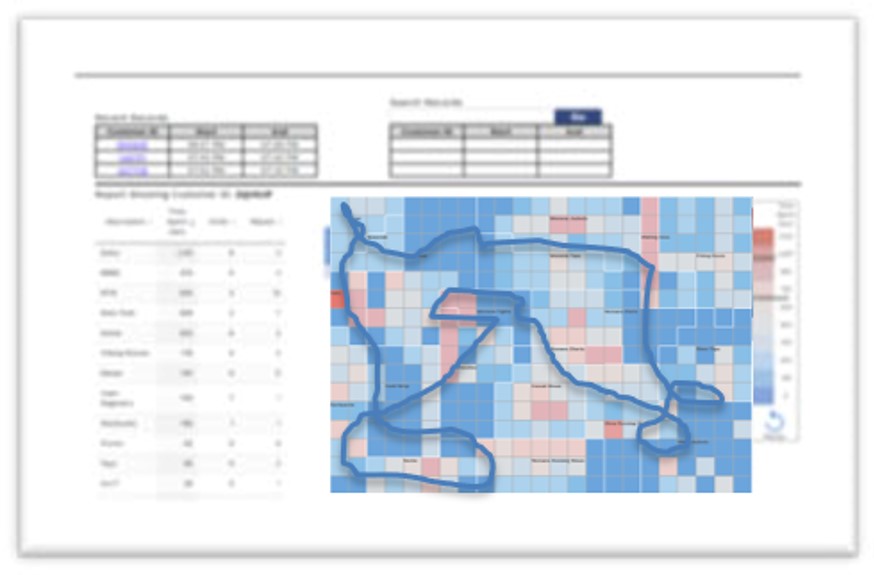
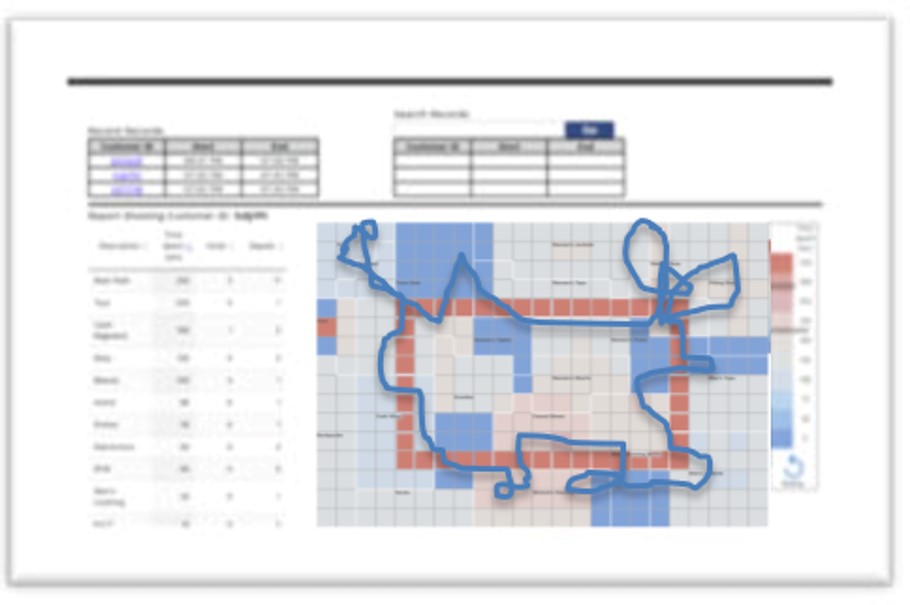
That report includes two elements: a tabular breakdown of the visit by time spent and graphical animation of the shopper visit laid on the digital planogram of the store. The tabular view is sorted by time spent and shows all the sections in the store the shopper visited, how much time they spent, and whether they returned to the section (went to it more than once). The animation is built on top of the store layout view (a core part of DM1) and replays the journey in fifteen seconds with time spent relative to replay time.
This custom report view is what the survey giver uses to drive the survey.
But it’s not the only report available. Since all the data is collected, it can also be analyzed quantitatively in the core DM1 Workbench and it can even be segmented by survey response variables uploaded through the meta-data interface.
It’s a compelling combination – helping drive the survey itself, providing a rich quantification of the data afterward, and making it easy for Insight Safari to show how specific individual patterns translate into significant population segments.
And a Little bit About the Results
Obviously the findings are both totally proprietary and highly particularized to the client. This isn’t the sort of research that leads to some standardized best-practice recommendation. But there are some high-level aspects of the project that I found striking.
First, while there are some very straightforward shopping visits where the behavior is crisp and matches closely to intent, the number of those visits is dramatically lower than what we see when we look at Websites. Most visits are amazingly complex squiggly patterns that bear only a passing resemblance to any kind of coordinated exploration of the store.
Sure, there are visits where, for example, a race-track pattern is dominant. But in almost all those visits there are least a few strange loops, diversions, and short-cuts. Further, the degree to which shopper intent doesn’t capture the intricacy (or even the primary focus) of the visit is much more visible in store visits than in comparable Website visits. Stores just are better distractors than Websites – and the physical realities of navigating a space create many more opportunities for divergence.
Second, the ability to see how experiential elements like coffee bars impacted both the behavior and emotional impact of the shopper journey was fascinating. It’s really hard to measure how these elements are driving PoS, but when you hear how people talk about it and how much it changes their sense and description of the shopping experience, it really comes alive. Making shoppers want to come to the store is part and parcel of today’s retail mission. And hearing how a smile from a barista can transform a chore into a reprieve from the daily grind is just one of the ways that VoC can make behavioral data sing.
And lastly, these behavior patterns are often most telling for what shoppers didn’t do. In case after case, we could see shopper’s lop-off parts of the journey that seemed like the logical extensions of their basic path. Some of those turning points were highly individual and probably hard to action – but others showed up with a consistency that made it clear that for some journeys, the store layout just wasn’t optimal.
Get a Piece of the Action
I don’t think there’s a store in the world that wouldn’t benefit from this kind of thoughtful research. Intelligent Voice of Customer is always provocative and useful. And the integration of Digital Mortar’s behavioral journey mapping into the Insight Safari process lets them do what they do at a level that simply can’t be matched with any other technique. It truly is the best of both worlds.
To learn more, give either of us a shout!