The Really Short Introduction to Digital Mortar and our DM1 Store Measurement Platform
The Really Short Introduction to Digital Mortar and our DM1 Store Measurement Platform
By Gary Angel
|May 14, 2018
Take a minute (okay – a minute and a half) to check out this video overview of our DM1 store measurement platform. It’s the shortest and crispest introduction we’ve produced so far.
As more than one famous writer/philosopher has remarked, “If I had more time, it would have been shorter.” Brevity, like wit, takes work. And practice. We haven’t achieved wit, but we’re getting close to brevity:
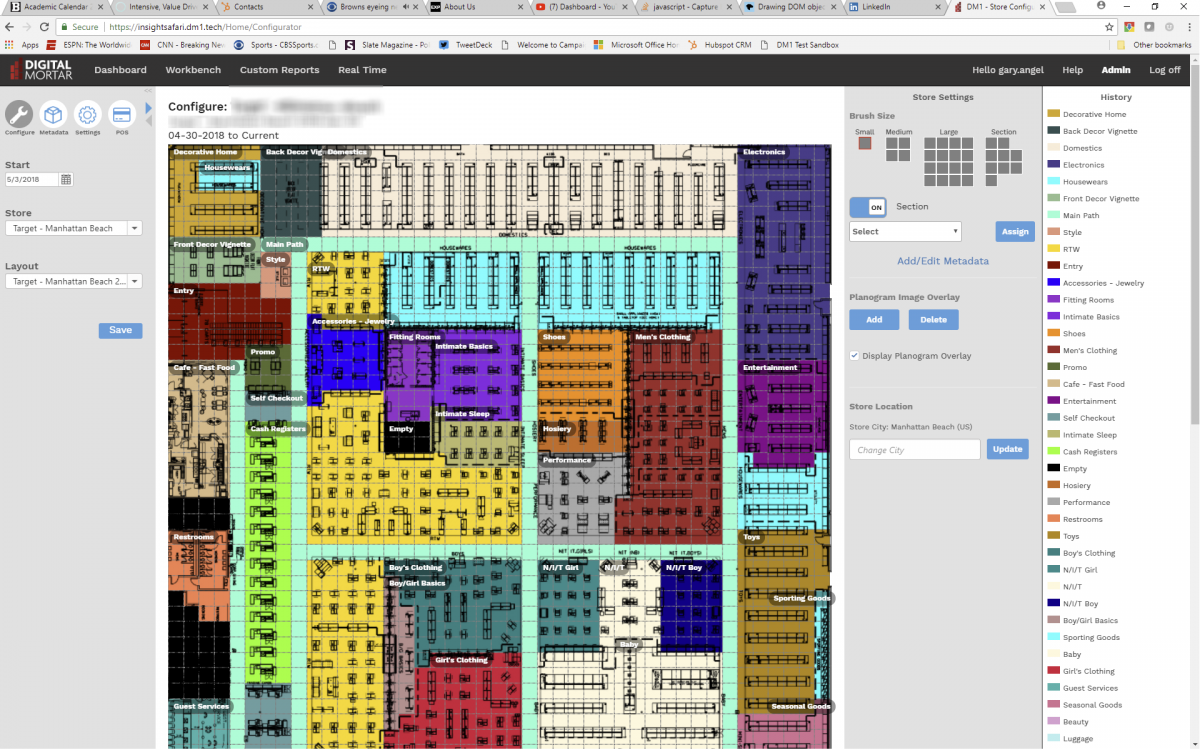
I also really like the video’s flow. It starts with a very short intro into the basic concept of store measurement and then introduces the platform with the Digital Planogram tool – the Configurator. When you get right down to it, this capability is the single most important part of the platform. Digital representations of the store are critical to every report and analysis DM1 delivers. And the ability to rapidly create, adjust and maintain those digital maps is essential to making the tool work.
When we first released DM1 the configurator lagged behind some of the reporting tools – not very friendly and a little prone to bugginess. Its grown into quite a good tool – a pleasure to use and capable of handling even very complex store layouts pretty easily.
From the configurator, the video flows into the Layout tool – which just maps metrics right onto those digital planograms. Not only does this show how effortlessly you move from a map of the store to a metric, but I really like the way the video works through a small set of metrics to show how easy the visual interpretation is.
Once you’ve got a feel for basic metrics in the Store Layout, the next logical step is to tackle journey. And the next two sections highlight funnel and path analysis. Both of these tools help transition thinking from a static view of store performance to a focus on shopper journey. Funnels tell you how effective the store is in moving shoppers down an engagement path. Path helps you understand which in-store paths are popular and which drive conversion. After this, it’s a quick look at the data exploration capabilities of the platform – and the ability to build reports around whatever problem you choose to tackle. Finally, it wraps up with a sample of the dashboards.
Truth to tell, I’ve sometimes done this same presentation in almost the reverse order – starting with Dashboards and ending with configuration. It’s plausible that way too, but I think this works better for analysts. Because while dashboards are the first view for end-users of DM1, for analysts their task really starts with store mapping, proceeds through various levels of analysis, and ends with wrapping a nice, neat bow around the data for others. That’s that way this video proceeds and that makes the structure more compelling and natural if that’s the way you tend to think.
Hey, unless you’re a very fast reader, you’ve already spent more time on this post than the you will on the video!
You can view it in quiet mode perfectly well or you can flip on audio and get my announcer voice.
And if you want something a little more leisurely, invest an extra minute with the somewhat oxymoronic – Short and Detailed Walkthrough!