The STARs Clock: A Data Visualization for Associate Optimization
The STARs Clock: A Data Visualization for Associate Optimization
By Gary Angel
|September 9, 2021

We’ve recently been using a data visualization focused on measuring the intra-day impact of shopper to labor ratios on conversion in the store that’s worth a look.
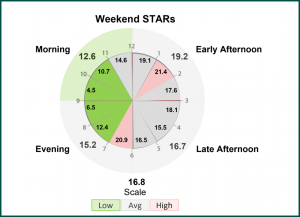
Why is STARS data important? It’s one of the best and most direct uses of shopper journey data- an intra-day STARs analysis can significantly improve labor models. Everybody knows overall store traffic and PoS, but without detailed traffic intra-day, it’s impossible to know if you have the right number of Associates working the floor. Too few Associates and your potentially leaving money on the table OR creating bad customer experiences. Too many Associates and your reducing margins. By combining Shopper Traffic and Associate presence by time of day, you get the intra-day STARs ratio. Take that ratio and compare it to conversion rates by area and you have powerful statistical measurement of whether you’re appropriately staffed at any given time for any given day of the week.
The visualization is called a STARS (that’s Shopper to Associate Ratio) Clock.
Podcast: Play in new window | Download
Subscribe: RSS