The Strange Case of the Misinterpreted KPI
The Strange Case of the Misinterpreted KPI
By Gary Angel
|October 23, 2023
The first thing people expect to get from people-measurement isn’t analytics or even testing support. It’s reporting. Before you can figure out how to make things better or whether a change worked, you need to understand how things are. That’s what reporting does. It creates organizational understanding of how a system is working.
How does it do that? Usually, reports are designed to capture the most important measurements of how the systems is doing – these are called KPIs (Key Performance Indicators). By focusing on a small number of very important measurements, reports can be simplified focusing the report-consumer on the things that matter most.
Or, at least, that’s the theory. But when it comes to behavioral analytics, it turns out that straightforward KPIs almost never work. We learned this first in digital analytics and eCommerce, but the lesson is every bit as relevant to stores and hearkens back to the discussion of intentionality in my last post.
Is, for example, time on site or time in store a KPI? Almost everybody thinks it is. But that would imply that spending more time is always better. But what if a customer spends a lot of time because they can’t find what they want? Perhaps the site or store is poorly laid out or confusing or the desired products or information aren’t available. Is more time still a good thing? You can improve time on site by making slower loading pages or reducing the number of open cash registers in a store so that lines get very long. Congratulations, you’ve improved a KPI!
You may be thinking that if time isn’t a clean KPI, something like conversion rate surely is. After all, if conversion rate improves, that must be good, right?
Nope.
Suppose that your newest marketing campaign is driving lots of bargain basement shoppers to your store and they buy only the lowest margin products. It may look like conversion (and even basket size) is going up, but your store or site may be performing significantly worse. Similarly, a drop in conversion rate might be a good thing. Suppose the amount of traffic going by your store improves dramatically. Your conversion rate may fall because you’re getting more potential shoppers in the door, even though some of them are less qualified. That’s still a net win.
This whole idea of KPIs based on intentional segmentation originated long ago from my experience measuring a hotel web site. We’d built a traditional KPI report and the single most important KPI – surfaced all the way up to the CEO of a huge hospitality company – was look-to-book rate (site visitors / site conversions). One summer day, the look to book ratio for their website skyrocketed and stayed up. It set off alarm bells throughout the organization and we had to figure out what was broken. Embarrassingly, it turned out that on the day in question, they’d rolled out a change to their property Wi-Fi where connected visitors landed on the website as their first page. Suddenly, you had a massive up-surge in visits to the website by people who had no intention of booking a room because they were sitting IN a room. The result was a precipitous and entirely meaningless increase in the ratio of site visitors to site bookings (or, to flip the metric, a steep fall in conversion rate).
The point of this is that it’s almost impossible to find store or side wide KPIs that can be interpreted simply in terms of direction. That’s because your site or store will have more than one kind of visitor with more than one type of intention and mixing those together can create confusing signals.
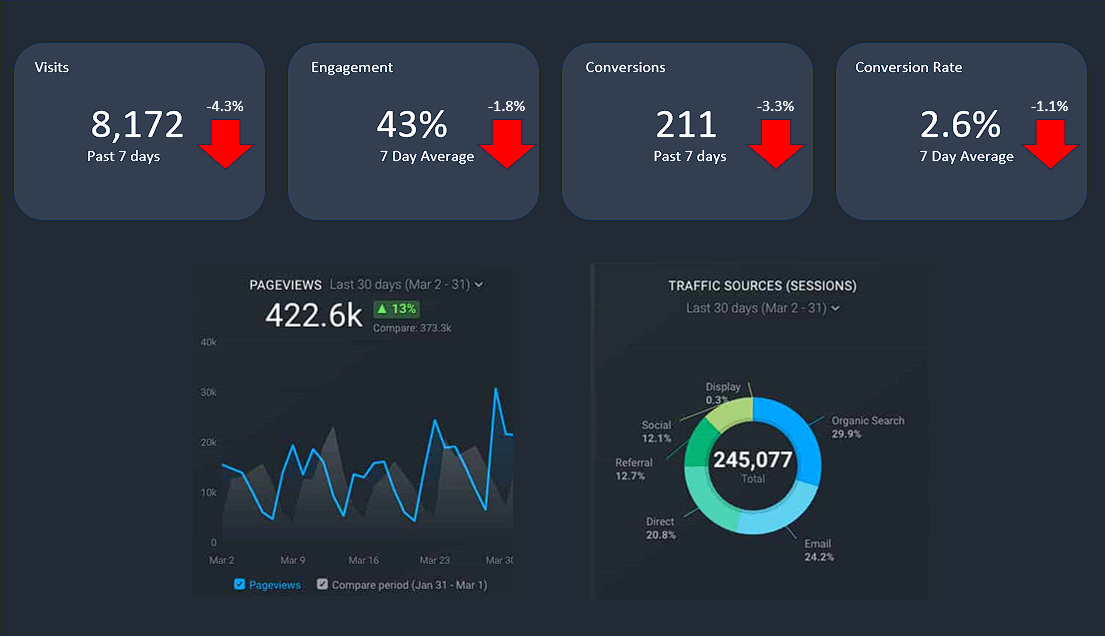
Unfortunately, report consumers don’t think this way. If they see a report like this:

Their natural and logical reaction is to think that things are getting worse. Everything in the report is built to tell that story. And yet, nothing about that story is necessarily true. Even when every single reported KPI is going down (as is the case here), the story might not be correct.
Unsegmented KPI reports aren’t useless. They are worse than useless. They actively encourage people to make bad assumptions about their data and their performance.
This doesn’t mean that reporting can’t work. KPIs can be rescued by framing them with a segmentation. Going back to the hotel example, if you make on-property Wi-Fi connectors a segment, you’ve helped isolate conversion rate in your actual shopping segment (making it cleaner with much higher signal to noise) and you’ve given yourself room to think about what’s an appropriate KPI for those in-room visitors (room service orders perhaps?).
Of course, in-room customers aren’t the only segments visiting a hotel website. There will be people looking up the address of their property. People looking to cancel a reservation. People checking to find out if their property has parking or other amenities. People looking for a support phone number. Even job seekers. Bookings are not a KPI for any of these segments. And within your potential bookings segment, you may have a vast range of shopping types with dramatically different natural conversion rates and value per conversion. Wedding planners, bargain-basement shoppers, convention goers…they might all book but the conversion rate and value of the bookings will be completely different.
So, if you don’t segment off all these types of visits, your conversion rate metrics are going to be noisy. They will nearly always reflect changes in the distribution of customer visits not the actual performance of the store or the site.
The same is true for almost every kind of business – digital or physical. Stores don’t have just one kind of visitor and their performance is driven more by the type of shoppers who come through the door than whatever the store does inside.
In my old digital analytics days, I told my clients that a report should NEVER show unsegmented KPIs or metrics. That’s a broad generalization, but it has a lot of truth. In my next post, I’ll show how a segmentation can work in a physical location and explain why it makes KPIs and reporting vastly better.