Applied Display Analytics : Operationalizing Test & Measure for Display
Applied Display Analytics : Operationalizing Test & Measure for Display
By Gary Angel
|August 21, 2020
One question I often get when people first start thinking about display analytics boils down to “why should we care – especially if we sell other people’s stuff?”
It’s a fair question. If sales is what matters (and sales IS what matters) then why do you need any display measurement beyond PoS?
Several Reasons:
PoS isn’t always a very clear signal.
PoS is NEVER a prescriptive signal – it doesn’t tell you what might work better or why something is failing.
PoS is useless for understanding showrooming and branding concepts.
Of these – the second is the most important.
I come from the digital world where people have long since gotten over the idea that sales is all that matters. Walk into an Amazon Go store and you’ll see a lot more measurement that PoS. Why? Because Amazon learned that the only way to optimize sales is to optimize experience. So on their website and in their stores, they measure everything.
That’s kind of what we do to. Digital Mortar measures every part of the part of the path to purchase. And one of the most important parts is merchandising and display. Understanding how Display functions can create significant opportunities for improvement that benefit everyone.
Case Study
One of the most compelling aspects of in-store display measurement is how easy it is to actually advantage of the data. For people who don’t do analytics regularly, it’s often surprising that data doesn’t always deliver magical insight. Data doesn’t always create new understanding and new understanding doesn’t always generate new action. That second point, in particular, is often a painful reality as it’s far from uncommon to get interesting data but simply not see a straightforward path to using it to change anything.
But what we’ve found in display analytics is that the path from data to understanding to action is remarkably straightforward and I want to highlight a recent project as an example.
The work (for a retailer with more than 500 stores) focused on their front of store Feature area. Near the front of these destination stores is a set of feature tables that highlight seasonal product trends. One of the big questions the client had about the area was whether anyone actually stopped and looked. That’s a pretty basic question, but it highlights a real truth about in-store display. For the most part, nobody has the faintest idea how shoppers behave at key merchandising areas in the store. They installed our merchandising analytics system at a couple of key stores to measure this feature area.
What they learned was fascinating.
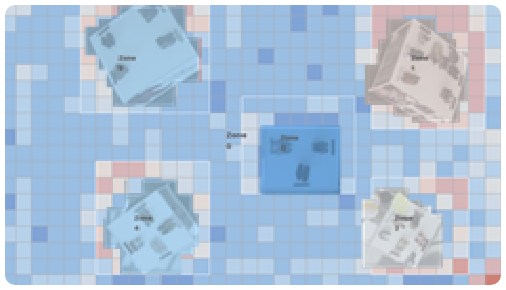
The initial area was setup as a five table layout with four tables forming a square and the fifth table in the center. There was plenty of space for shoppers to flow directly through the feature table area.
Despite that, what they learned that the center table was hardly trafficked. Of all the shopper passing through the area, only 7% entered the engagement zone around the center table. Virtually all the traffic flowed along the right hand side of the feature tables and across the front face (toward the cash-wrap).
They also saw that product interactions by table varied significantly, and that the feature with the highest interaction and engagement rate was the third most heavily trafficked.
And, of course, they got their basic questions answered. They could see how much traffic passed by the display and what percentage engaged with it.
Here’s the thing. Answering that main question didn’t actually generate action. But looking at the other data sure did. The first test they ran involved moving the center table to the front face where the traffic actually passed. The result of that simple test? An almost 500% increase in the amount of traffic and engagement at that table. 500%! You just don’t’ get test results like that very often.
More structured testing involved rotating product sets to heavily trafficked areas. Adding disruptive displays to alter the flow of traffic into the area. And changing the type of product on the tables. Thinking up this kind of visual merchandising test isn’t rocket science. The testing ideas are obvious. The measurement, once the system is in place, is trivial. And the results consistently impactful. Believe me, that combination of easy test ideas, straightforward measurement and impactful results
Read the full case study here.
Display Testing Ideas
Display analytics is a rare case where the combination of easy test ideas, straightforward measurement and impactful results all come together.
That sounds great, but are the test ideas really that easy?
Let me go back to the case study problem. It had a five table feature display. The test I described (which resulted in a remarkable 500% improvement) involved moving the center table to a more trafficked corridor. That’s great. But how many other tests are possible?
In any multiple display area, it’s surprisingly easy to build a set of structured tests that will almost certainly deliver improved performance. We measured each displays traffic, engagement and product interaction rate. Naturally, some displays got more traffic than others. Some had higher engagement and interaction rates. That’s inevitable.
The first goal of testing should be to understand how this works. Is traffic a function of display or geography. And what about engagement? By rotating product across displays measuring, tests can establish a baseline for traffic at each display area independent of product. This also tells you how much impact display has on traffic patterns.
Now test shifting the best performing product (by baseline) into the highest traffic areas. That’s an obvious move, right? If you think about, there’s an almost unending series of products tests that make sense. You’re trying to optimize product mix across and within each display. You’re also trying to maximize product to flow geography. In most multi-display areas, you’ll get different types of shoppers. In our test, we saw that some tables got primarily entrance traffic while others got traffic traffic mostly from shoppers heading across the area to go to the cashwrap. The best product mix for each navigation flow is different and testable.
For table displays, there’s also a whole series of tests related to facings and interaction points. Depending on flow, the position of the table and the angle of the table make a big difference in how much product interaction there was. Testing angles also revealed that by angling the table we could shape flow and influence traffic at other displays. Maximizing product to table placement is another whole series of obvious tests.
It’s just not hard.
Between display placement, configuration, product mix, flow optimization and facings, you have a whole series of obvious, structured tests appropriate to almost any feature display area. So yes, Virginia, when it comes to display measurement, it really is easy to generate test ideas.
Find out more!