Machine Learning and Optimal Store Path
Machine Learning and Optimal Store Path
By Gary Angel
|May 7, 2018
My previous post covered the first half of my presentation on Machine Learning (ML) and store analytics at the Toronto Symposium. Here, I’m going to work through the case study on using ML to derive an optimal store path. For that analysis, we used our DM1 platform to source, clean, map and aggregate the data and then worked with a data science partner (DXi) on the actual analysis.
Why this problem?
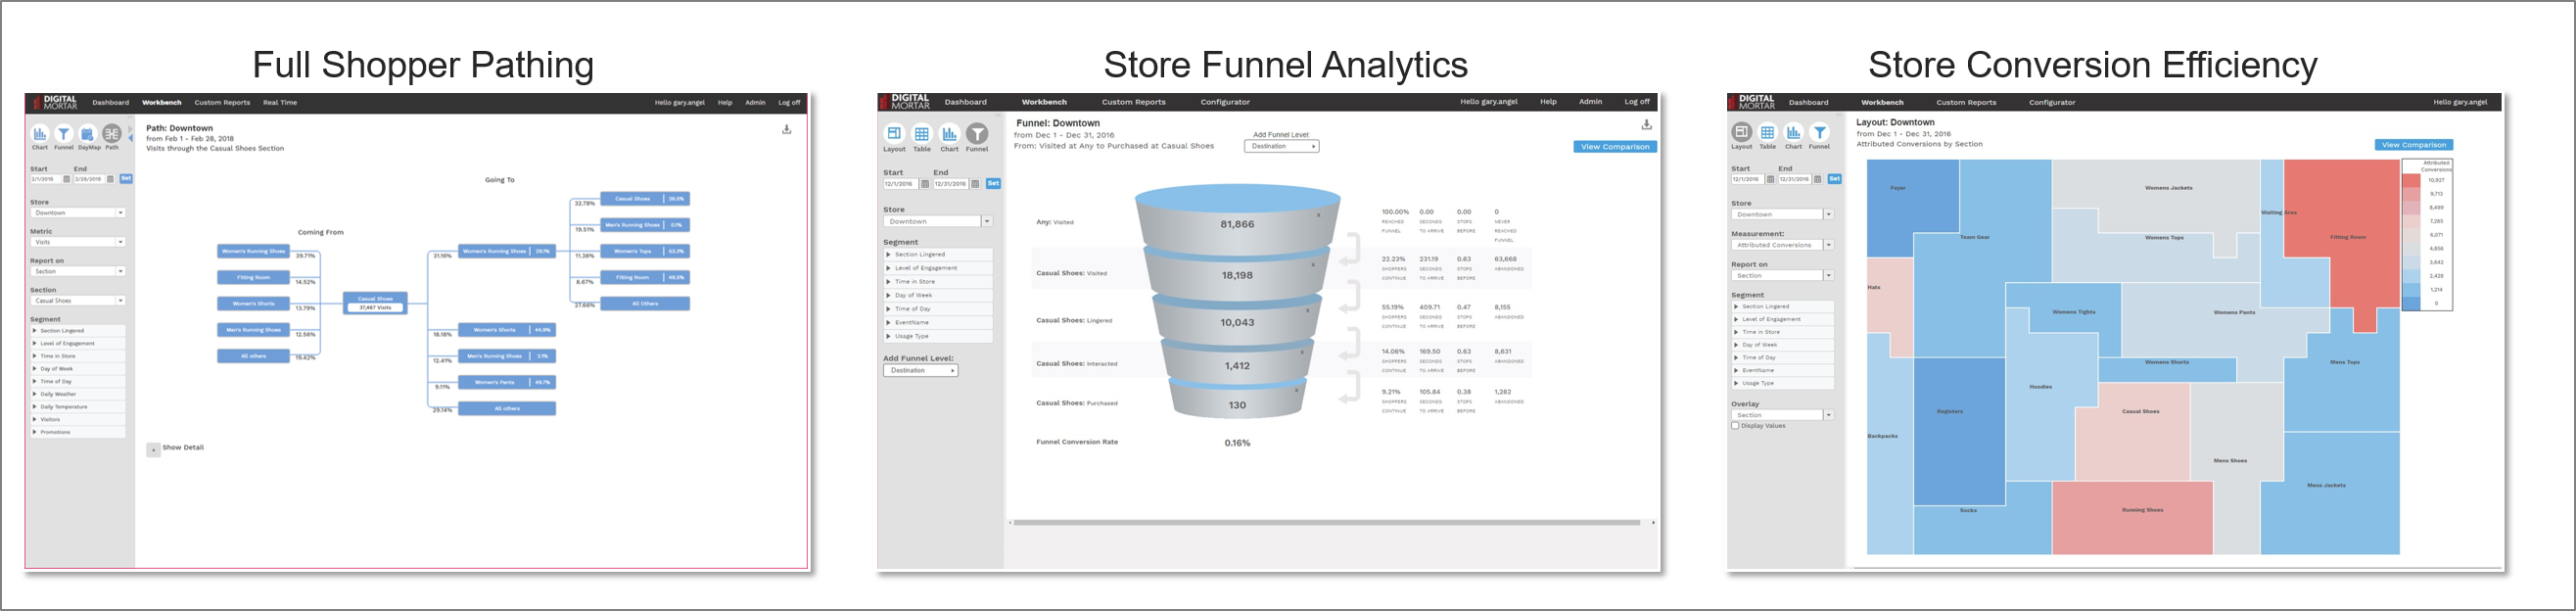
Within DM1 we feel pretty good about the way we’ve built out visualizations of the store data that are easy to use and surprisingly powerful. The Full Path View, Funnel View and Store Layout View all provide really good ways to explore shopper path in the store.
But for an analyst, exploring data and figuring out a model are utterly different tasks. A typical store presents a nearly infinite number of possible paths – even when the paths are aggregated up to section level. So there’s no way to just explore the paths and find optimal ones.
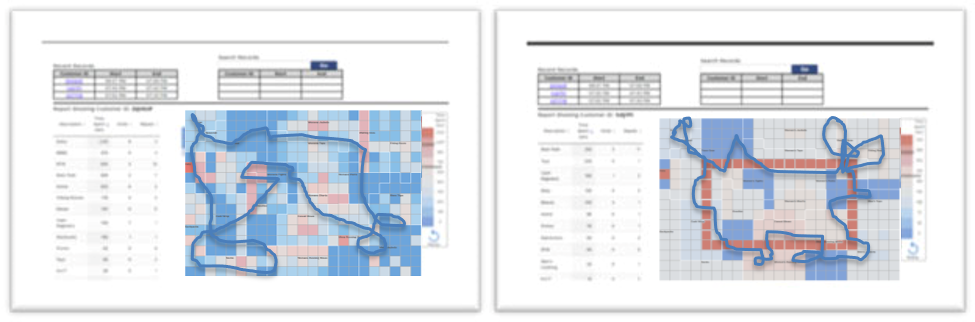
Even at the most basic level of examining individual shopper paths, deciding what’s good and bad is really hard. Here’s two shopper paths in a store:
Which is better? Does either have issues? It’s pretty hard to know.
Why Machine Learning?
Optimal store pathing meets the basic requirements for using supervised ML – we have a lot of data and we have a success criteria (checkout). But ML isn’t worth deploying on every problem that has a lot of data and success criteria. I think about it this way – if I can get want I want by writing simple algorithmic code, then I don’t need ML. In other words, if I can write (for example) a sort and then some simple If-Then rules that will identify the best path or find problem path points, then that’s what we’ll do. If, for example, I just wanted to identify sections that didn’t convert well, it would be trivial to do that. I have a conversion efficiency metric, I sort by it (Ascending) and then I take the worst performers. Or maybe I have a conversion threshold and simply pick any Section that performs worse. Maybe I even calculate a standard deviation and select any section that is worse than 1 standard deviation below the average Section conversion efficiency. All easy.
But none of those things are really very useful when it comes to finding poor path performance in a robust fashion.
So we tried ML.
The Analysis Basics
The analysis was focused on a mid-sized apparel store with around 25 sections. We had more than 25,000 shopper visits. Which may not seem like very much if you’re used to digital analytics, but is a pretty good behavior base for a store. In addition to the basic shopper journey, we also had Associate interaction points (and time of interaction), and whether or not the shopper converted. The goal was to find potential store layout problems and understand which parts of the store drove to (or subtracted from) overall conversion efficiency.
Preparing the Data
The first step in any analysis (once you know what you want) is usually data preparation.
Our data starts off as a stream of location events. Those location events have an X,Y, Z coordinates that are offset from a zero point in the store. In the DM1 platform, we take that data and map it against a digital planogram capability that keeps a full, historical record of the store. That tells us what shoppers actually looked and where they spent time. This is the single most critical step in turning the raw data into something that’s analytically useful.
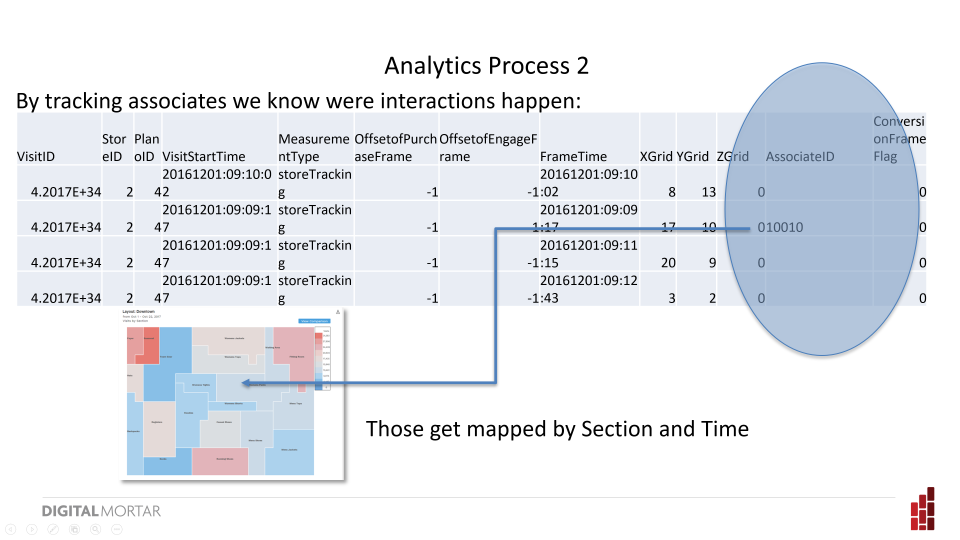
Since we also track Associates, we can track interaction points by overlaying the Associate data stream on top of the shopper stream. This isn’t perfect – it’s easy to miss short interactions or be confused by a crowded store – but particularly when it’s app to app tracking it works pretty well. Associate interaction points are hugely important in the store (as the subsequent analysis will prove).
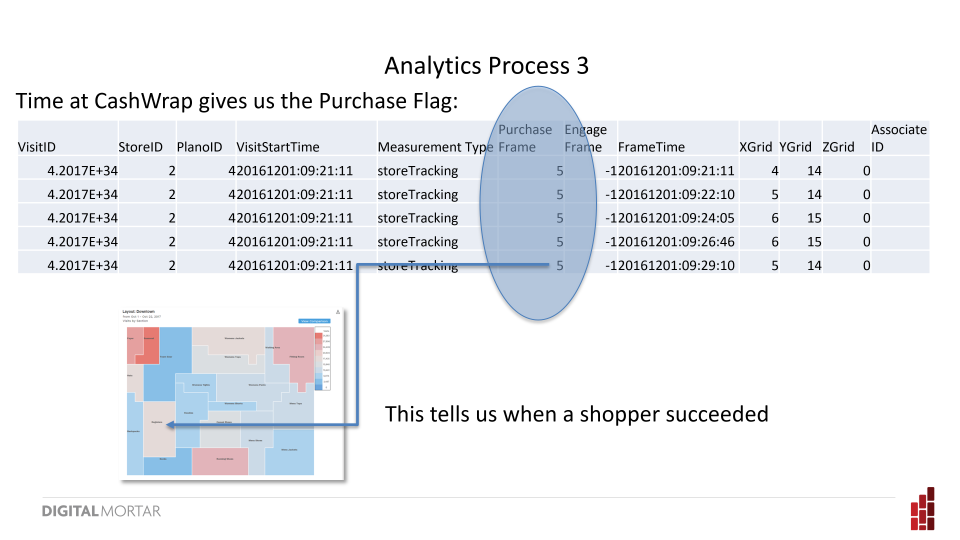
Step 3 is knowing whether and when a shopper purchased. Most of the standard machine learning algorithms require having a way to determine if a behavior pattern was successful or not – that’s what they are optimizing too. We’re using purchase as our success metric.
The underlying event data gets aggregated into a single row per shopper visit. That row contains a visit identifier, a start and stop time, an interaction count, a first interaction time, a last interaction time, the first section visited, the time spent in each section and, of course, our success metric – a purchase flag.
That’s it.
The actual analytic heavy lifting was done by DXi on their machine learning platform. They use an ensemble approach – throwing the kitchen sink at the problem by using 25+ different algorithms to identify potential winners/losers (if you’d like more info or an introduction to them, drop me a line and I’ll connect you).
Findings
Here’s some of the interesting stuff that surfaced, plucked from the Case-Study I gave at the Symposium:
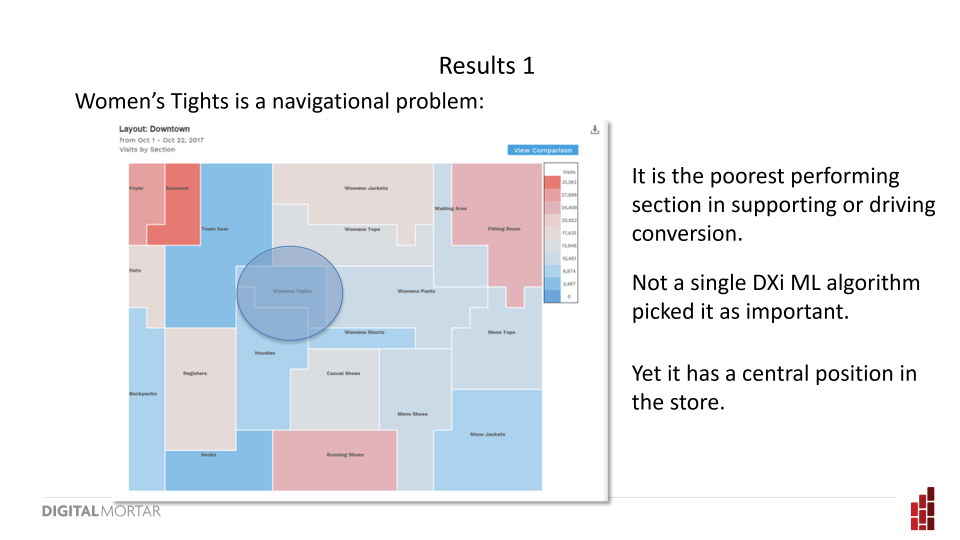
One of the poorest performing sections – unpicked by a single DXi ML algorithm as important – sits right smack dab in the middle of the store. That central position really surprised us. Yes, as you’ll see in a moment, the store has a successful right rail pattern – but this was a fairly trafficked spot with good sightlines and easy flow into high-value areas of the store.
Didn’t work well though. And that’s definitely worth thinking about from a store layout perspective.
One common browsing behavior for shoppers is a race-track pattern – navigating around the perimeter of the store. There’s a good example of that on the right-side image I showed earlier:
The main navigation path through the store is the red rectangle (red because this shopper spent considerable time there) – and you can see that while the shopper frequently deviated from that main path that their overall journey was a circuit around the store.
The ML algo’s don’t know anything about that – but they did pick out the relevant sections in the analyzed store along that starting path as really important for conversion.
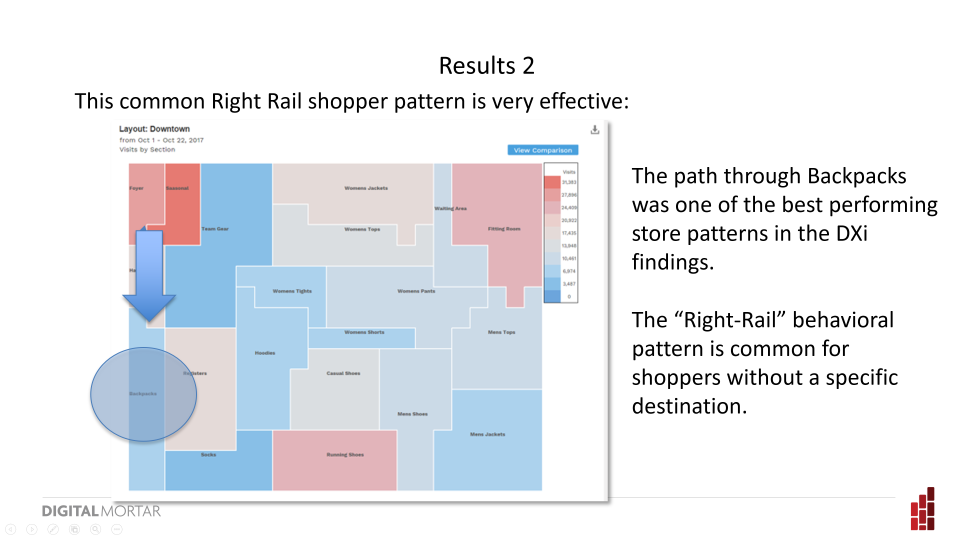
We took that to mean that the store is working well for that race-track shopper type. An important learning.
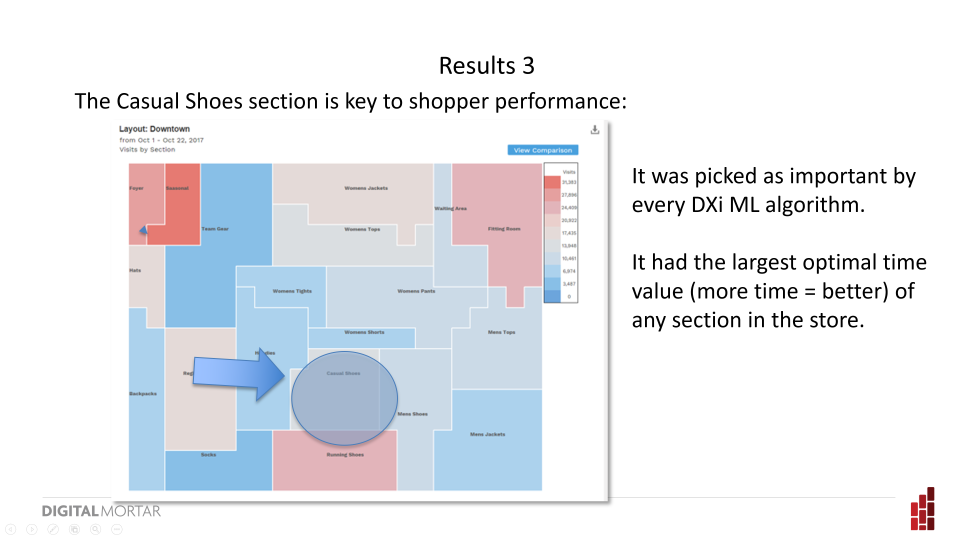
For this particular store, casual shoes was picked as important by every ML algorithm – making it the most important section of the store. It also had the largest optimal time value – and clearly rewarded more time with higher conversion rates. Shoes, of course, is going to be this way. It’s not a grab and go item. So there’s an element of the obvious here – something you should expect when you unleash ML on a dataset (and hey – most analytics projects will, if they work at all, vacillate between the interesting and the obvious). But even compared to other types of shoe – this section performed better and rewarded more time spent – so there is an apples-to-apples part of this comparison as well.
The next finding was an interesting one and illustrates a bit of the balance you need to think about between the analyst and the algorithm. The display in question was located fairly close to cash-wrap on a common path to checkout. It didn’t perform horribly in the ML – some of the DXi algorithms did pick it as important for conversion. On the other hand, it was one of the few sections with a negative weighting to time spent – so more time spent means less likely conversion. We interpreted that combination as indicating that the section’s success was driven by geography not efficiency. It’s kind of like comparing Saudi Arabia vs. U.S. Shale drillers. Based purely on the numbers, Saudi Arabia looks super efficient and successful with the lowest cost per barrel of oil extracted in the world. But when you factor in the geographic challenges, the picture changes completely. SA has the easiest path to oil recovery in the world. Shale producers face huge and complex technical challenges and still manage to be price competitive. Geography matters and that’s just a core fact of in-store analytics.
Our take on the numbers when we sifted through the DXi findings was that this section was actually underperforming. It might take a real A/B test to prove that, but regardless I think it’s a good example of how an analyst has to do more than run an algorithm. It’s easy to fool even very sophisticated algorithms with strong correlations and so much of our post-analysis ANALYSIS was about understanding how the store geography and the algorithm results play together.
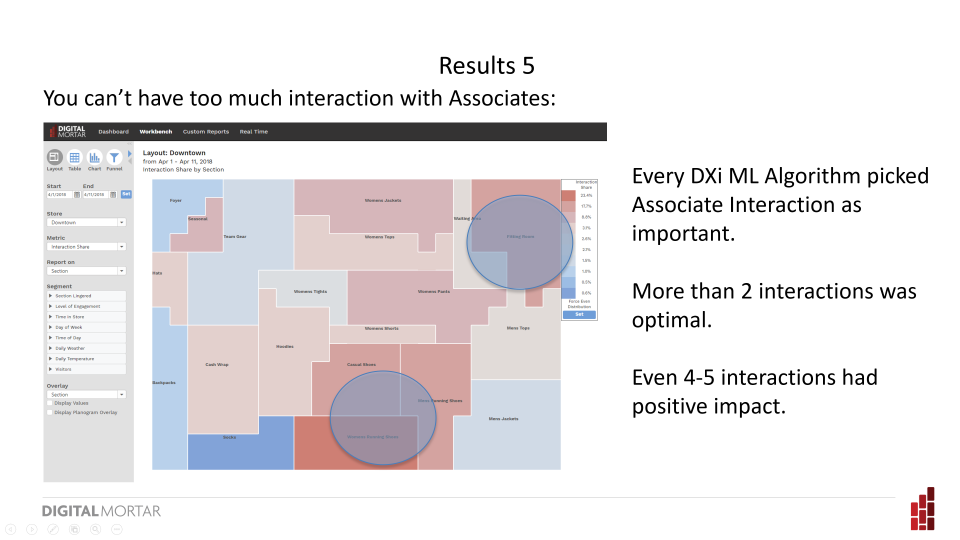
In addition to navigation findings like these, the analysis also included the impact of Associates on conversion. In general, the answer we got was the more interactions the merrier (at the cash register). Not every store may yield the same finding (and it’s also worth thinking about whether a single conversion optimization metric is appropriate here – in my Why Analytics Fails talk I argue for the value in picking potentially countervailing KPIs like conversion and shopper satisfaction as dual optimization points).
Even after multiple interactions, additional interactions had a positive impact on sales.
This should be obvious but I’ll hearken back to our early digital analytics days to make a point. We sometimes found that viewing more pages on a Website was a driver of conversion success. But that didn’t mean chopping pages in half (as one client did) so that that the user had to consume more pages to read the same content was a good strategy.
Just because multiple Associate interactions in a store with a normal interaction strategy created lift, it doesn’t mean that, for example, having your Associates tackle customers (INTERACTIOOOON!!!) as they navigate the floor will boost conversion.
But in this case, too much interaction was a legitimate concern. And the data indicates that – at least as measured by conversion rates – the concern did not manifest itself in shopper turn-off.
If you’re interested in getting the whole deck – just drop me a note. It’s a nice intro into the kind of shopper journey tracking you can do with our DM1 platform and some of the ways that machine learning can be used to drive better practice. And, as I mentioned, if you’d like to check out the DXi stuff – and it’s interesting from a pure digital perspective too – drop me a line and I’ll introduce you.
One thought on “Machine Learning and Optimal Store Path”
Leave a Reply
You must be logged in to post a comment.
Gary – great article – good insights. I like your emphasis on finding true opportunities to leverage ML rather than throw everything and the kitchen sink at it.